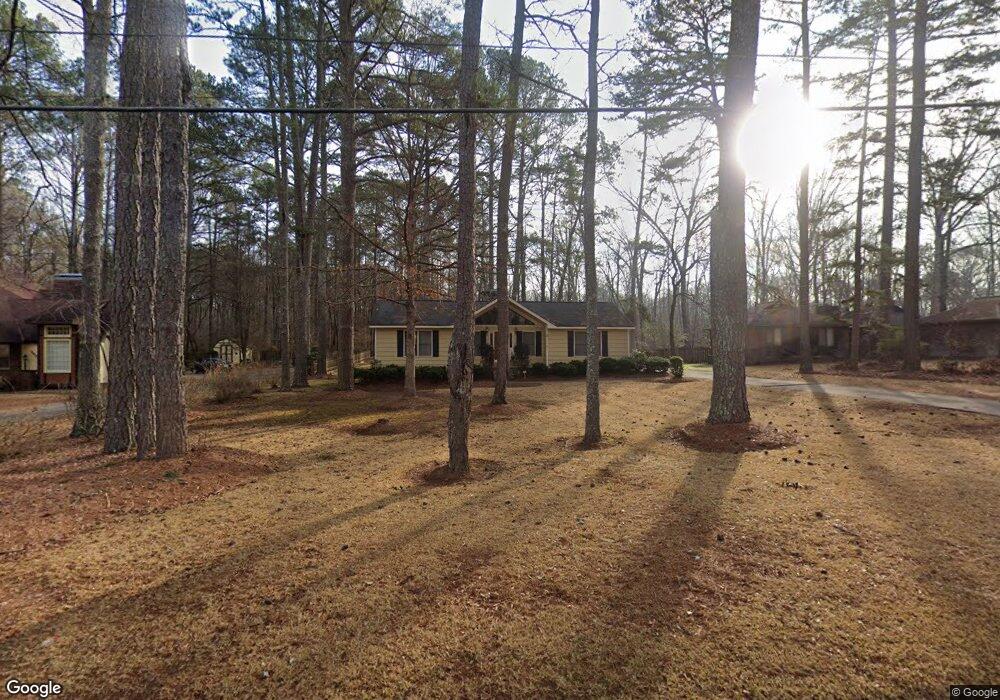
2221 Honeybee Creek Dr Unit 1 Griffin, GA 30224
Spalding County NeighborhoodEstimated Value: $224,319 - $257,000
3
Beds
2
Baths
1,634
Sq Ft
$148/Sq Ft
Est. Value
About This Home
This home is located at 2221 Honeybee Creek Dr Unit 1, Griffin, GA 30224 and is currently estimated at $242,330, approximately $148 per square foot. 2221 Honeybee Creek Dr Unit 1 is a home located in Spalding County with nearby schools including Crescent Road Elementary School, Rehoboth Road Middle School, and Spalding High School.
Ownership History
Date
Name
Owned For
Owner Type
Purchase Details
Closed on
Feb 24, 2012
Sold by
Rogers William H
Bought by
Rogers Jenna Jimmerson
Current Estimated Value
Purchase Details
Closed on
Oct 3, 2001
Sold by
Elder William H and Elder Susan M
Bought by
Rogers William H
Home Financials for this Owner
Home Financials are based on the most recent Mortgage that was taken out on this home.
Original Mortgage
$98,000
Interest Rate
6.74%
Mortgage Type
New Conventional
Purchase Details
Closed on
Nov 10, 1978
Sold by
Stone W Bryant
Bought by
Elder William H and Elder Susan M
Purchase Details
Closed on
Apr 24, 1978
Sold by
Miller Richard D and Miller Robyn K
Bought by
Stone W Bryant
Purchase Details
Closed on
Jul 23, 1977
Sold by
Duncan Dan M
Bought by
Miller Richard D and Miller Robyn K
Purchase Details
Closed on
Jul 23, 1973
Sold by
Jones Maurice E and Jones Mickey M
Bought by
Duncan Dan M
Create a Home Valuation Report for This Property
The Home Valuation Report is an in-depth analysis detailing your home's value as well as a comparison with similar homes in the area
Home Values in the Area
Average Home Value in this Area
Purchase History
| Date | Buyer | Sale Price | Title Company |
|---|---|---|---|
| Rogers Jenna Jimmerson | -- | -- | |
| Rogers William H | $110,000 | -- | |
| Elder William H | $44,500 | -- | |
| Stone W Bryant | $4,800 | -- | |
| Miller Richard D | $4,800 | -- | |
| Duncan Dan M | $3,400 | -- |
Source: Public Records
Mortgage History
| Date | Status | Borrower | Loan Amount |
|---|---|---|---|
| Previous Owner | Rogers William H | $98,000 |
Source: Public Records
Tax History Compared to Growth
Tax History
| Year | Tax Paid | Tax Assessment Tax Assessment Total Assessment is a certain percentage of the fair market value that is determined by local assessors to be the total taxable value of land and additions on the property. | Land | Improvement |
|---|---|---|---|---|
| 2024 | $2,190 | $63,009 | $11,400 | $51,609 |
| 2023 | $2,190 | $63,009 | $11,400 | $51,609 |
| 2022 | $1,893 | $53,860 | $10,000 | $43,860 |
| 2021 | $1,651 | $47,216 | $10,000 | $37,216 |
| 2020 | $1,328 | $38,183 | $10,000 | $28,183 |
| 2019 | $1,328 | $37,472 | $10,000 | $27,472 |
| 2018 | $1,268 | $34,992 | $10,000 | $24,992 |
| 2017 | $1,149 | $32,645 | $10,000 | $22,645 |
| 2016 | $1,114 | $31,237 | $10,000 | $21,237 |
| 2015 | $1,148 | $31,237 | $10,000 | $21,237 |
| 2014 | $1,171 | $31,237 | $10,000 | $21,237 |
Source: Public Records
Map
Nearby Homes
- 0 Sweetbriar Ln Unit B 20110670
- 0 Cedardale Dr Unit 10272855
- 1 Sweetbriar Ln Unit A
- 2203 Honeybee Creek Dr
- TRACT D Cedardale Drive Sweetbriar Ln
- 2105 Honeybee Creek Dr
- 1022 Waverly Dr
- 1058 Waverly Dr
- LOT 48 Waverly Dr Unit 1
- LOT 47 Waverly Dr Unit 1
- LOT 69 Waverly Dr Unit 1
- LOT 68 Waverly Dr Unit 1
- LOT 67 Waverly Dr Unit 1
- LOT 66 Waverly Dr Unit 1
- LOT 65 Waverly Dr Unit 1
- LOT 46 Waverly Dr Unit 1
- LOT 45 Waverly Dr Unit 1
- LOT 44 Waverly Dr Unit 1
- LOT 43 Waverly Dr Unit 1
- LOT 42 Waverly Dr Unit 1
- 2223 Honeybee Creek Dr
- 2219 Honeybee Creek Dr
- 2225 Honeybee Creek Dr
- 2217 Honeybee Creek Dr
- 2218 Honeybee Creek Dr
- 2220 Honeybee Creek Dr
- 2216 Honeybee Creek Dr
- 2227 Honeybee Creek Dr
- 2215 Honeybee Creek Dr Unit 1
- 2222 Honeybee Creek Dr
- 0 Sweetbriar Ln Unit TR B 3273840
- 0 Sweetbriar Ln Unit TR A 3273813
- 0 Sweetbriar Ln Unit A 7490610
- 0 Sweetbriar Ln Unit LOT B 7490611
- 0 Sweetbriar Ln Unit A 8135205
- 0 Sweetbriar Ln Unit B 8135201
- 0 Sweetbriar Ln Unit 20051108
- 0 Sweetbriar Ln Unit TRACT B 20051104
- 0 Sweetbriar Ln Unit 3128072
- 0 Sweetbriar Ln Unit 7154036