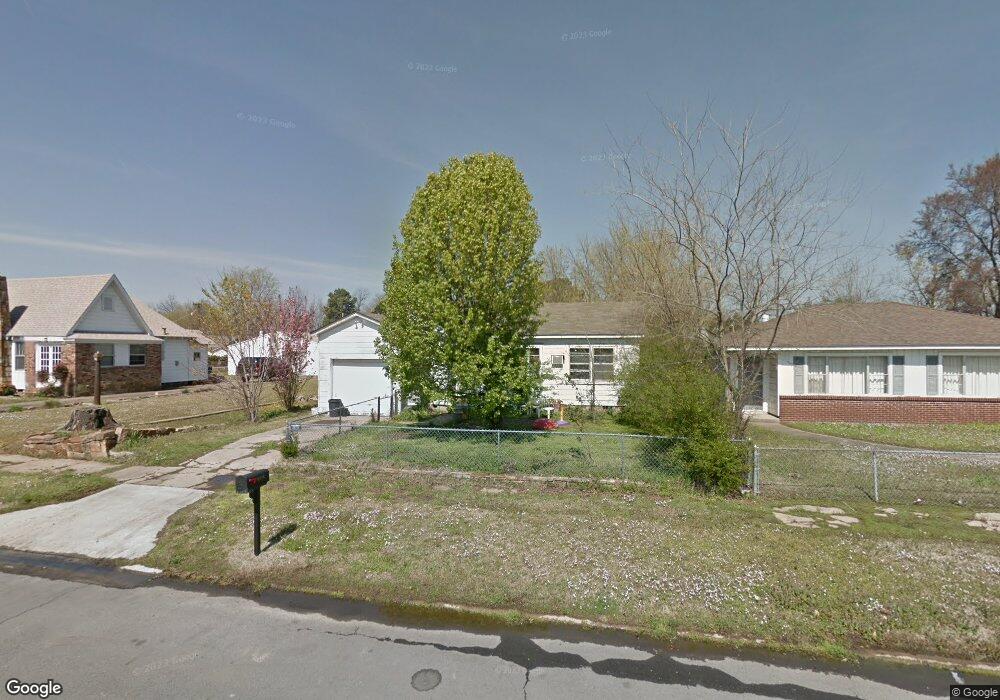
2221 N 8th St Fort Smith, AR 72904
Estimated Value: $65,000 - $94,000
Studio
3
Baths
976
Sq Ft
$83/Sq Ft
Est. Value
About This Home
This home is located at 2221 N 8th St, Fort Smith, AR 72904 and is currently estimated at $80,531, approximately $82 per square foot. 2221 N 8th St is a home located in Sebastian County with nearby schools including Howard Elementary School, William O. Darby Junior High School, and Northside High School.
Ownership History
Date
Name
Owned For
Owner Type
Purchase Details
Closed on
Jul 11, 2017
Sold by
Walker Misty D and Walker Travis S
Bought by
Facio Lorena and Facio Jorge
Current Estimated Value
Purchase Details
Closed on
Dec 13, 2016
Sold by
Estate Of Donna M Anderson
Bought by
Luiz April and Johnson Deanna
Purchase Details
Closed on
Sep 19, 2012
Sold by
Cook Margaret M
Bought by
Anderson Donna M
Purchase Details
Closed on
May 29, 2002
Bought by
Cook Margaret M
Purchase Details
Closed on
Oct 6, 1998
Bought by
Cook Charles D and Cook Margaret M
Purchase Details
Closed on
Aug 1, 1995
Bought by
Dean James Allen and Cheryl Ann
Purchase Details
Closed on
May 16, 1994
Bought by
Hansen Edwin R and Jo Ann Famil
Purchase Details
Closed on
Jan 23, 1981
Bought by
Fries Jo Ann
Purchase Details
Closed on
Oct 19, 1977
Bought by
Robinson Frances L and Robinson James A
Create a Home Valuation Report for This Property
The Home Valuation Report is an in-depth analysis detailing your home's value as well as a comparison with similar homes in the area
Home Values in the Area
Average Home Value in this Area
Purchase History
We collect this data history from publicly available records. To have your information removed, we recommend requesting removal directly through your county’s website.
| Date | Buyer | Sale Price | Title Company |
|---|---|---|---|
| Facio Lorena | $13,000 | None Available | |
| Luiz April | -- | None Available | |
| Walker Travis | -- | None Available | |
| Anderson Donna M | -- | Land Title & Closing Inc | |
| Cook Margaret M | -- | -- | |
| Cook Margaret M | -- | -- | |
| Cook Charles D | $24,000 | -- | |
| Dean James Allen | $23,000 | -- | |
| Hansen Edwin R | -- | -- | |
| Fries Jo Ann | -- | -- | |
| Robinson Frances L | -- | -- |
Source: Public Records
Tax History
| Year | Tax Paid | Tax Assessment Tax Assessment Total Assessment is a certain percentage of the fair market value that is determined by local assessors to be the total taxable value of land and additions on the property. | Land | Improvement |
|---|---|---|---|---|
| 2025 | $447 | $12,508 | $2,000 | $10,508 |
| 2024 | $368 | $7,000 | $1,000 | $6,000 |
| 2023 | $406 | $7,000 | $1,000 | $6,000 |
| 2022 | $406 | $7,000 | $1,000 | $6,000 |
| 2021 | $406 | $7,000 | $1,000 | $6,000 |
| 2020 | $383 | $7,000 | $1,000 | $6,000 |
| 2019 | $348 | $5,990 | $1,000 | $4,990 |
| 2018 | $348 | $5,990 | $1,000 | $4,990 |
| 2017 | $314 | $5,990 | $1,000 | $4,990 |
| 2016 | $314 | $5,990 | $1,000 | $4,990 |
| 2015 | $314 | $5,990 | $1,000 | $4,990 |
| 2014 | $332 | $6,330 | $1,000 | $5,330 |
Source: Public Records
Map
Nearby Homes
- 2617 N 23rd St
- 1919 N 7th St
- 2312 Wirsing Ave
- 1925 N 6th St
- 2307 N 29th St
- 2423 N 30th St
- 1921 N 12th St
- 1701 Short 7th St
- 2301 N 31st St
- 1808 N 13th St
- 2021 N 30th St
- 2910 Virginia Ave
- 2912 Blair Ave
- 3401 N S St
- 1625 N 8th St
- 1206 N 6th St
- 3610 Johnson St
- 1712 N 12th St
- 3623 Wirsing Ave
- 1119 N 13th St
Your Personal Tour Guide
Ask me questions while you tour the home.