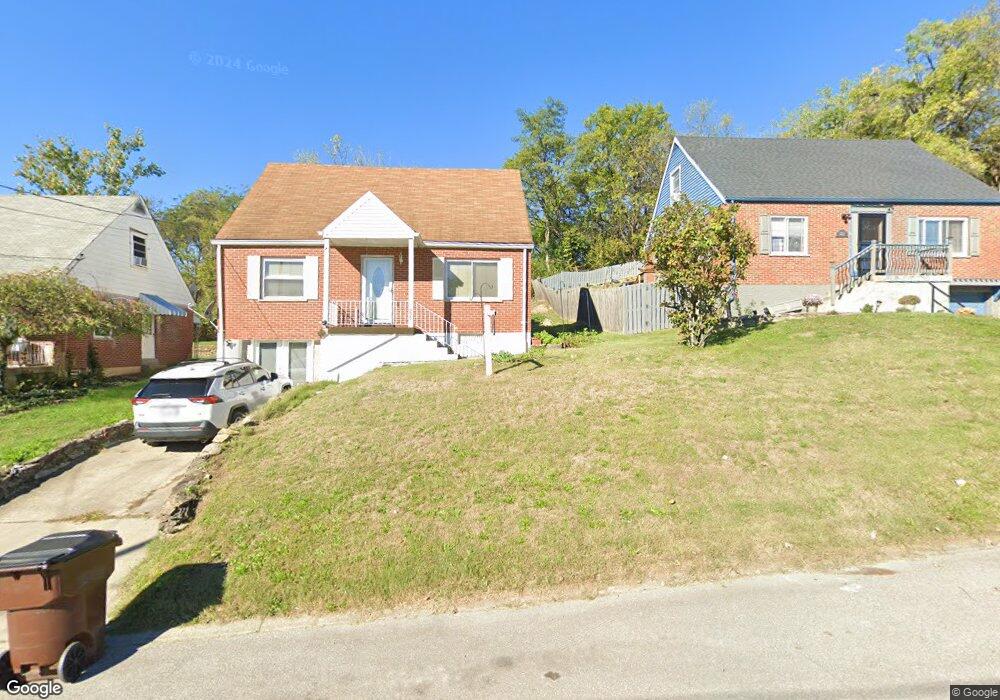
2221 New Linden Rd Newport, KY 41071
Estimated Value: $182,000 - $210,000
3
Beds
1
Bath
1,248
Sq Ft
$158/Sq Ft
Est. Value
About This Home
This home is located at 2221 New Linden Rd, Newport, KY 41071 and is currently estimated at $197,614, approximately $158 per square foot. 2221 New Linden Rd is a home located in Campbell County with nearby schools including Newport Primary School, Newport Intermediate School, and Newport High School.
Ownership History
Date
Name
Owned For
Owner Type
Purchase Details
Closed on
Sep 24, 2019
Sold by
Pangallo Dino Vincent and Pangallo Anthony Michael
Bought by
Gaunce Jeffrey C and Gaunce Radchadawan
Current Estimated Value
Home Financials for this Owner
Home Financials are based on the most recent Mortgage that was taken out on this home.
Original Mortgage
$99,900
Outstanding Balance
$87,505
Interest Rate
3.6%
Mortgage Type
New Conventional
Estimated Equity
$110,109
Purchase Details
Closed on
Apr 26, 2016
Sold by
Pangallo Anthony M and Pangallo Marcella
Bought by
Pangallo Anthony Michael and Lavo Marcella
Purchase Details
Closed on
Feb 20, 1998
Sold by
Cincinnati Central Credi
Bought by
Pangallo Anthony M and Pangallo Marcella
Home Financials for this Owner
Home Financials are based on the most recent Mortgage that was taken out on this home.
Original Mortgage
$62,709
Interest Rate
8%
Mortgage Type
New Conventional
Create a Home Valuation Report for This Property
The Home Valuation Report is an in-depth analysis detailing your home's value as well as a comparison with similar homes in the area
Home Values in the Area
Average Home Value in this Area
Purchase History
| Date | Buyer | Sale Price | Title Company |
|---|---|---|---|
| Gaunce Jeffrey C | $111,000 | Pro Title Llc | |
| Gaunce Jeffrey C | $111,000 | Pro Title Llc | |
| Pangallo Anthony Michael | -- | None Available | |
| Pangallo Anthony M | $63,000 | -- |
Source: Public Records
Mortgage History
| Date | Status | Borrower | Loan Amount |
|---|---|---|---|
| Open | Gaunce Jeffrey C | $99,900 | |
| Closed | Gaunce Jeffrey C | $99,900 | |
| Previous Owner | Pangallo Anthony M | $62,709 |
Source: Public Records
Tax History Compared to Growth
Tax History
| Year | Tax Paid | Tax Assessment Tax Assessment Total Assessment is a certain percentage of the fair market value that is determined by local assessors to be the total taxable value of land and additions on the property. | Land | Improvement |
|---|---|---|---|---|
| 2024 | $531 | $138,000 | $20,000 | $118,000 |
| 2023 | $438 | $111,000 | $10,300 | $100,700 |
| 2022 | $511 | $111,000 | $10,300 | $100,700 |
| 2021 | $524 | $111,000 | $10,300 | $100,700 |
| 2020 | $533 | $111,000 | $10,300 | $100,700 |
| 2019 | $342 | $104,000 | $10,300 | $93,700 |
| 2018 | $345 | $104,000 | $10,300 | $93,700 |
| 2017 | $276 | $104,000 | $10,300 | $93,700 |
| 2016 | $321 | $104,000 | $0 | $0 |
| 2015 | $326 | $104,000 | $0 | $0 |
| 2014 | $324 | $104,000 | $0 | $0 |
Source: Public Records
Map
Nearby Homes
- 2220 New Linden Rd
- 2115 Joyce Ave
- 8 Laycock Ln
- 2115 Monmouth St
- 100 Mayo Cir
- 252 Linden Ave
- 39 19th St
- 43.5-45.5, Kentucky Dr
- 85 & 87 Kentucky Dr
- 260 Bluegrass Ave
- 3008 Nob Hill Dr
- 8012 Nob Hill Dr
- 58 16th St
- 94 Home St
- 12 Amelia St
- 118 Electric Ave
- 41 W 14th St
- 15 Custis Ave
- 1125 Park Ave
- 125 15th St
- 2219 New Linden Rd
- 2223 New Linden Rd
- 2217 New Linden Rd
- 2225 New Linden Rd
- 2215 New Linden Rd
- 2213 New Linden Rd
- 2226 New Linden Rd
- 2227 New Linden Rd
- 2224 New Linden Rd
- 2228 New Linden Rd
- 2222 New Linden Rd
- 2211 New Linden Rd
- 2229 New Linden Rd
- 2209 New Linden Rd
- 2 Adrian Ct
- 4 Adrian Ct
- 18 E Ridge Place
- 12 E Ridge Place
- 2214 New Linden Rd
- 6 Adrian Ct