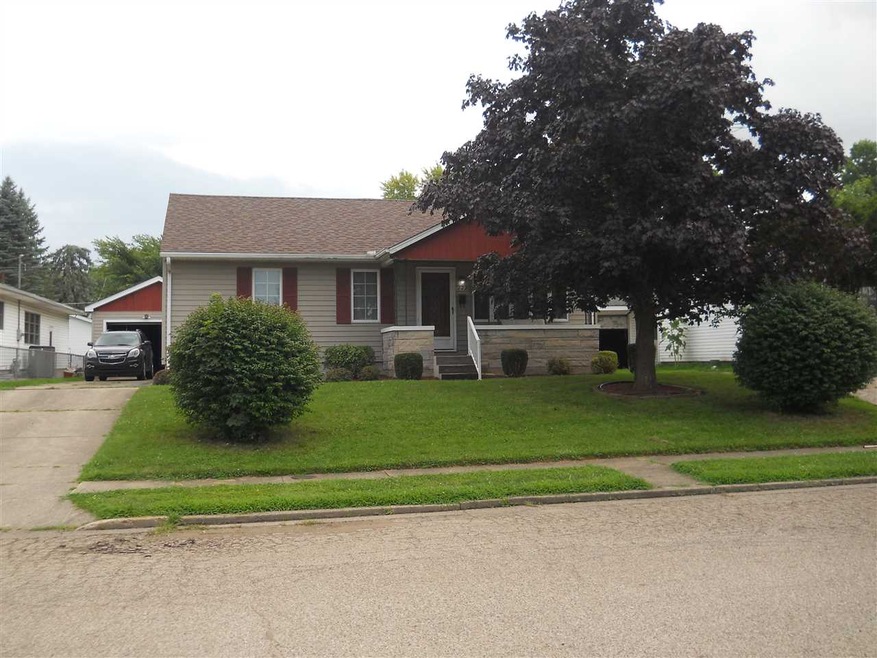
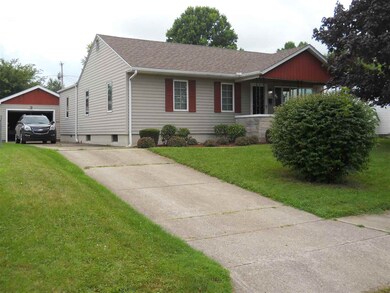

2221 Otto St Logansport, IN 46947
Estimated Value: $164,134 - $185,000
Highlights
- Ranch Style House
- Covered Patio or Porch
- Double Pane Windows
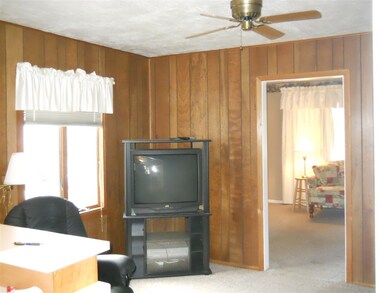
- Wood Flooring
- 1 Car Detached Garage
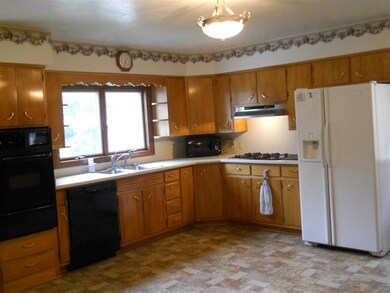
- Breakfast Bar
About This Home
As of September 2018This 1440sq ft home has a partially finished full basement, 3 bedrooms 1 1/2 baths, Zinn Kitchen cabinets and all apppliances stay. New Roof in August 2018,Fenced in Yard,One car Detached garage,Concrete Driveway,Central Air,East end close to High School
Home Details
Home Type
- Single Family
Est. Annual Taxes
- $629
Year Built
- Built in 1950
Lot Details
- 9,148 Sq Ft Lot
- Lot Dimensions are 57 x 166
- Chain Link Fence
- Level Lot
Parking
- 1 Car Detached Garage
Home Design
- Ranch Style House
- Shingle Roof
- Asphalt Roof
- Vinyl Construction Material
Interior Spaces
- Ceiling Fan
- Double Pane Windows
- Washer and Gas Dryer Hookup
Kitchen
- Breakfast Bar
- Laminate Countertops
- Disposal
Flooring
- Wood
- Carpet
- Vinyl
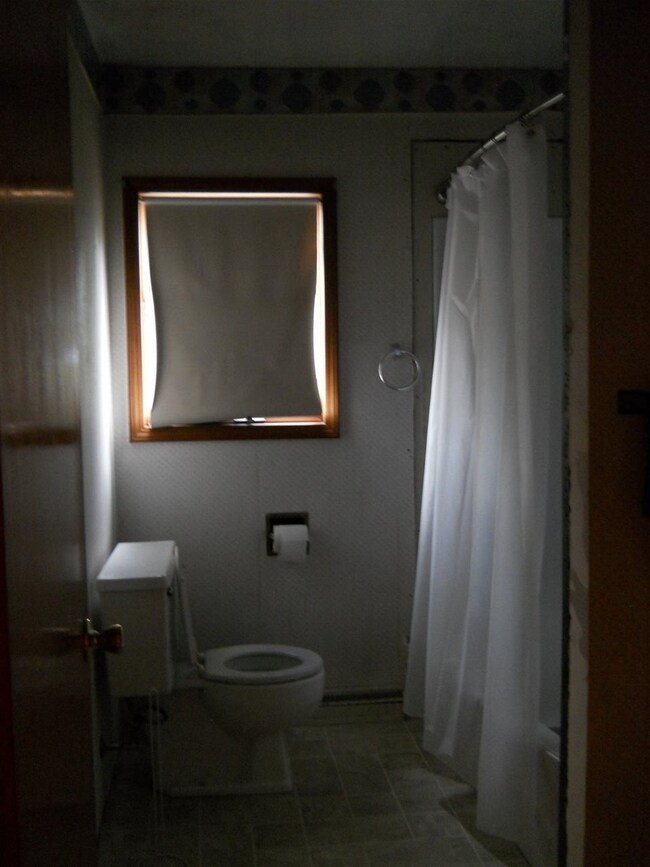
Bedrooms and Bathrooms
- 3 Bedrooms
- Bathtub with Shower
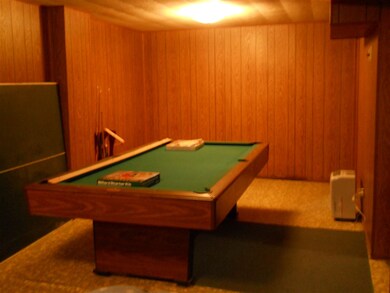
Partially Finished Basement
- Basement Fills Entire Space Under The House
- Block Basement Construction
- 1 Bathroom in Basement
Utilities
- Forced Air Heating and Cooling System
- Heating System Uses Gas
Additional Features
- Energy-Efficient Windows
- Covered Patio or Porch
- Suburban Location
Listing and Financial Details
- Assessor Parcel Number 09-17-29-336-006.000-010
Ownership History
Purchase Details
Home Financials for this Owner
Home Financials are based on the most recent Mortgage that was taken out on this home.Home Values in the Area
Average Home Value in this Area
Purchase History
| Date | Buyer | Sale Price | Title Company |
|---|---|---|---|
| Sanchez Yessica B | -- | Attorney Only |
Property History
| Date | Event | Price | List to Sale | Price per Sq Ft |
|---|---|---|---|---|
| 09/28/2018 09/28/18 | Sold | $90,000 | +0.6% | $48 / Sq Ft |
| 08/22/2018 08/22/18 | For Sale | $89,500 | -- | $48 / Sq Ft |
Tax History Compared to Growth
Tax History
| Year | Tax Paid | Tax Assessment Tax Assessment Total Assessment is a certain percentage of the fair market value that is determined by local assessors to be the total taxable value of land and additions on the property. | Land | Improvement |
|---|---|---|---|---|
| 2024 | $880 | $94,500 | $10,900 | $83,600 |
| 2022 | $783 | $79,200 | $10,900 | $68,300 |
| 2021 | $707 | $71,600 | $10,900 | $60,700 |
| 2020 | $656 | $68,900 | $10,900 | $58,000 |
| 2019 | $657 | $66,700 | $10,900 | $55,800 |
| 2018 | $617 | $59,000 | $10,900 | $48,100 |
| 2017 | $629 | $58,700 | $12,900 | $45,800 |
| 2016 | $544 | $54,900 | $12,900 | $42,000 |
| 2014 | $593 | $59,500 | $12,900 | $46,600 |
| 2013 | $593 | $60,100 | $12,800 | $47,300 |
Map
Source: Indiana Regional MLS
MLS Number: 201837887
APN: 09-17-29-336-006.000-010
Disclaimer: Certain information contained herein is derived from information provided by parties other than Homes.com. All information provided is deemed reliable, but is not guaranteed to be accurate and should be independently verified.
![]() IDX information is provided exclusively for personal, non-commercial use, and may not be used for any purpose other than to identify prospective properties consumers may be interested in purchasing. Information is deemed reliable but not guaranteed.
IDX information is provided exclusively for personal, non-commercial use, and may not be used for any purpose other than to identify prospective properties consumers may be interested in purchasing. Information is deemed reliable but not guaranteed.