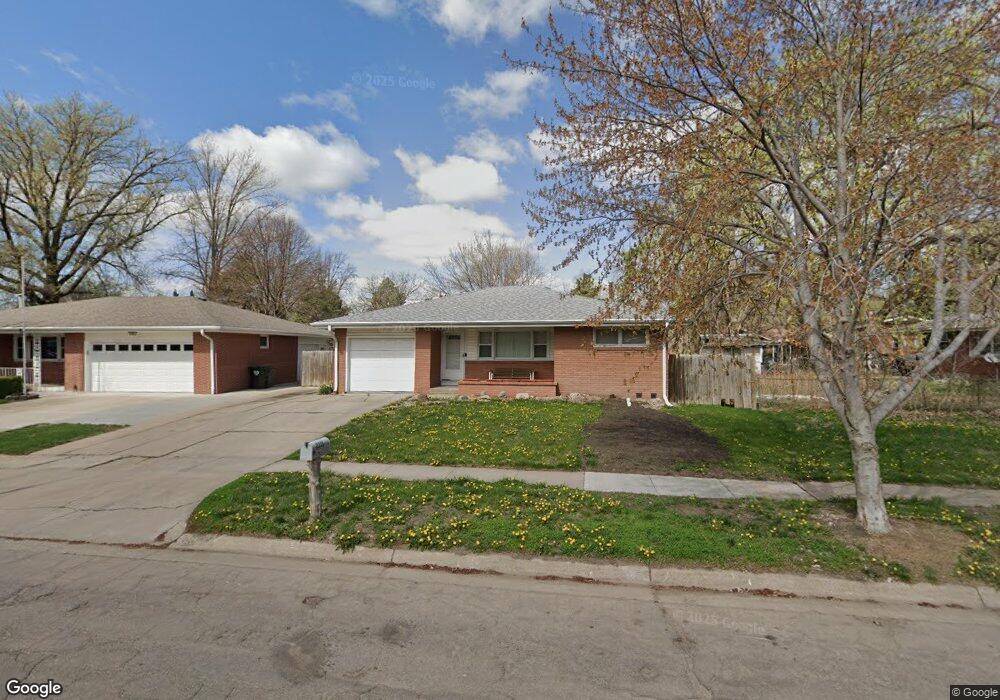
2221 S Cotner Blvd Lincoln, NE 68506
Greater South NeighborhoodEstimated Value: $251,000 - $266,000
3
Beds
2
Baths
1,587
Sq Ft
$163/Sq Ft
Est. Value
About This Home
This home is located at 2221 S Cotner Blvd, Lincoln, NE 68506 and is currently estimated at $259,095, approximately $163 per square foot. 2221 S Cotner Blvd is a home located in Lancaster County with nearby schools including Holmes Elementary School, Lefler Middle School, and Lincoln Southeast High School.
Ownership History
Date
Name
Owned For
Owner Type
Purchase Details
Closed on
Oct 15, 2015
Sold by
Wiechman Dicky L and Wiechman Kathleen
Bought by
Wiechman Simon C and Stauffer Jade L
Current Estimated Value
Home Financials for this Owner
Home Financials are based on the most recent Mortgage that was taken out on this home.
Original Mortgage
$98,188
Outstanding Balance
$76,911
Interest Rate
3.75%
Mortgage Type
FHA
Estimated Equity
$182,184
Purchase Details
Closed on
May 4, 2011
Sold by
Souza Walterson M and Santos Keila C
Bought by
Wiechman Dicky L and Wiechman Kathleen
Purchase Details
Closed on
Feb 21, 2005
Sold by
Sundling Thomas W and Sundling Connie J
Bought by
Souza Walterson M and Santos Keila C
Home Financials for this Owner
Home Financials are based on the most recent Mortgage that was taken out on this home.
Original Mortgage
$103,150
Interest Rate
5.77%
Mortgage Type
FHA
Create a Home Valuation Report for This Property
The Home Valuation Report is an in-depth analysis detailing your home's value as well as a comparison with similar homes in the area
Home Values in the Area
Average Home Value in this Area
Purchase History
| Date | Buyer | Sale Price | Title Company |
|---|---|---|---|
| Wiechman Simon C | $100,000 | Nebraska Title Co | |
| Wiechman Dicky L | $113,000 | Rels | |
| Souza Walterson M | $104,000 | -- |
Source: Public Records
Mortgage History
| Date | Status | Borrower | Loan Amount |
|---|---|---|---|
| Open | Wiechman Simon C | $98,188 | |
| Previous Owner | Souza Walterson M | $103,150 |
Source: Public Records
Tax History Compared to Growth
Tax History
| Year | Tax Paid | Tax Assessment Tax Assessment Total Assessment is a certain percentage of the fair market value that is determined by local assessors to be the total taxable value of land and additions on the property. | Land | Improvement |
|---|---|---|---|---|
| 2025 | $3,379 | $254,600 | $55,000 | $199,600 |
| 2024 | $3,379 | $242,200 | $50,000 | $192,200 |
| 2023 | $3,856 | $230,100 | $50,000 | $180,100 |
| 2022 | $3,300 | $165,600 | $40,000 | $125,600 |
| 2021 | $3,122 | $165,600 | $40,000 | $125,600 |
| 2020 | $3,155 | $165,100 | $40,000 | $125,100 |
| 2019 | $3,155 | $165,100 | $40,000 | $125,100 |
| 2018 | $2,641 | $137,600 | $40,000 | $97,600 |
| 2017 | $2,666 | $137,600 | $40,000 | $97,600 |
| 2016 | $2,553 | $131,100 | $35,000 | $96,100 |
| 2015 | $2,535 | $131,100 | $35,000 | $96,100 |
| 2014 | -- | $127,700 | $35,000 | $92,700 |
| 2013 | -- | $127,700 | $35,000 | $92,700 |
Source: Public Records
Map
Nearby Homes
- 4435 South St
- 2135 S 49th St
- 1845 S 47th St
- 9121 South St
- 9111 South St
- 9540 South St
- 2731 Anderson Dr
- 4210 Van Dorn St
- 1601 Ridgeway Rd
- 2750 S 40th St
- 1725 S 50th St
- 2831 S 47th St
- 1565 S 48th St
- 3700 Sewell St
- 2761 S 39th St
- 4541 Meadow Ln
- 2127 S 37th St
- 1425 Ridgeway Rd
- 3001 S 51 Street Ct Unit 103
- 3001 S 51st Street Ct Unit 537
- 2231 S Cotner Blvd
- 4431 Newton Cir
- 4421 Newton Cir
- 2241 S Cotner Blvd
- 4420 Normal Blvd
- 4411 Newton Cir
- 2220 S Cotner Blvd
- 2240 S Cotner Blvd
- 4501 Newton St
- 4340 Normal Blvd
- 4440 Normal Blvd
- 4430 Newton Cir
- 4401 Newton Cir
- 4500 Normal Blvd
- 4320 Normal Blvd
- 2140 S Cotner Blvd
- 4515 Newton St
- 4301 Normal Blvd
- 4301 Normal Blvd Unit 20
- 4301 Normal Blvd Unit 22