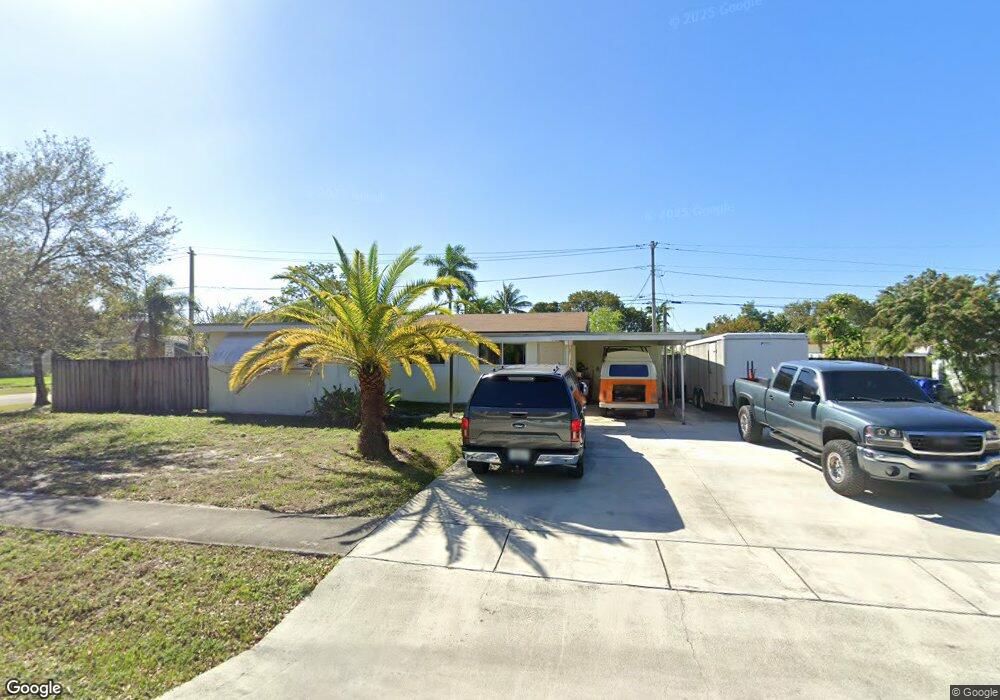
2221 SW 35th Ave Fort Lauderdale, FL 33312
Sunset NeighborhoodEstimated Value: $507,000 - $562,000
2
Beds
2
Baths
1,391
Sq Ft
$390/Sq Ft
Est. Value
About This Home
This home is located at 2221 SW 35th Ave, Fort Lauderdale, FL 33312 and is currently estimated at $542,369, approximately $389 per square foot. 2221 SW 35th Ave is a home located in Broward County with nearby schools including Stephen Foster Elementary School, New River Middle School, and Stranahan High School.
Ownership History
Date
Name
Owned For
Owner Type
Purchase Details
Closed on
Feb 28, 2005
Sold by
Seepersad Jennifer
Bought by
Marauszwski Peter J
Current Estimated Value
Home Financials for this Owner
Home Financials are based on the most recent Mortgage that was taken out on this home.
Original Mortgage
$200,000
Outstanding Balance
$101,395
Interest Rate
5.61%
Mortgage Type
New Conventional
Estimated Equity
$440,974
Purchase Details
Closed on
Feb 21, 2002
Sold by
Diaz Alfredo and Diaz Eusebia
Bought by
Seepersad Jennifer
Home Financials for this Owner
Home Financials are based on the most recent Mortgage that was taken out on this home.
Original Mortgage
$136,923
Interest Rate
6.81%
Mortgage Type
FHA
Purchase Details
Closed on
Aug 11, 2000
Sold by
Obuchowski Edwin L
Bought by
Diaz Alfredo and Diaz Eusebia
Purchase Details
Closed on
Jul 31, 2000
Sold by
Available Not
Bought by
Available Not
Create a Home Valuation Report for This Property
The Home Valuation Report is an in-depth analysis detailing your home's value as well as a comparison with similar homes in the area
Home Values in the Area
Average Home Value in this Area
Purchase History
| Date | Buyer | Sale Price | Title Company |
|---|---|---|---|
| Marauszwski Peter J | $250,000 | -- | |
| Seepersad Jennifer | $142,000 | -- | |
| Diaz Alfredo | $85,800 | -- | |
| Available Not | $98,500 | -- |
Source: Public Records
Mortgage History
| Date | Status | Borrower | Loan Amount |
|---|---|---|---|
| Open | Marauszwski Peter J | $200,000 | |
| Previous Owner | Seepersad Jennifer | $136,923 | |
| Previous Owner | Diaz Alfredo | $64,025 |
Source: Public Records
Tax History Compared to Growth
Tax History
| Year | Tax Paid | Tax Assessment Tax Assessment Total Assessment is a certain percentage of the fair market value that is determined by local assessors to be the total taxable value of land and additions on the property. | Land | Improvement |
|---|---|---|---|---|
| 2025 | $2,915 | $167,930 | -- | -- |
| 2024 | $2,828 | $163,200 | -- | -- |
| 2023 | $2,828 | $158,450 | $0 | $0 |
| 2022 | $2,656 | $153,840 | $0 | $0 |
| 2021 | $2,574 | $149,360 | $0 | $0 |
| 2020 | $2,477 | $144,580 | $0 | $0 |
| 2019 | $2,177 | $141,330 | $0 | $0 |
| 2018 | $2,026 | $138,700 | $0 | $0 |
| 2017 | $2,006 | $135,850 | $0 | $0 |
| 2016 | $2,011 | $133,060 | $0 | $0 |
| 2015 | $2,018 | $132,140 | $0 | $0 |
| 2014 | $2,031 | $131,100 | $0 | $0 |
| 2013 | -- | $129,170 | $33,900 | $95,270 |
Source: Public Records
Map
Nearby Homes
- 2320 SW 36th Ave
- 2140 SW 36th Ave
- 2248 SW 34th Way
- 2365 SW 34th Way
- 3621 Riverland Rd
- 3574 Riverland Rd
- 2041 SW 35th Ave
- 2406 Marathon Ln
- 3641 SW 23rd Ct
- 3640 SW 21st Ct
- 3645 SW 22nd St
- 2436 Gulfstream Ln
- 2413 Nassau Ln
- 1961 SW 36th Ave
- 3410 SW 25th St
- 2507 Flamingo Ln
- 2512 Gulfstream Ln
- 2524 Marathon Ln
- 3241 SW 23rd Ct
- 2531 Flamingo Ln
- 2211 SW 35th Ave
- 2220 SW 36th Ave
- 2210 SW 36th Ave
- 3500 SW 23rd St
- 2280 SW 35th Ave
- 2290 SW 35th Ave
- 2171 SW 35th Ave
- 2264 SW 35th Ave
- 2200 SW 36th Ave
- 3520 SW 23rd St
- 2300 SW 35th Ave
- 2248 SW 35th Ave
- 2311 SW 35th Ave
- 2160 SW 36th Ave
- 2161 SW 35th Ave
- 2316 SW 35th Ave
- 2221 SW 36th Ave
- 2281 SW 34th Way
- 2291 SW 34th Way