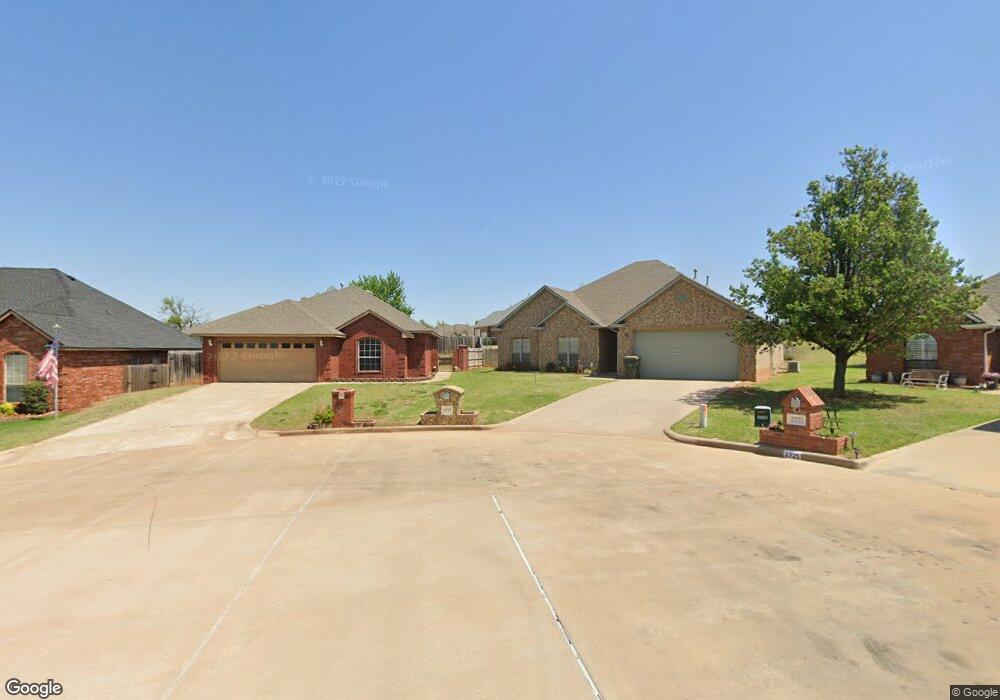
2221 University Blvd Chickasha, OK 73018
Estimated Value: $150,000 - $240,000
3
Beds
2
Baths
1,412
Sq Ft
$142/Sq Ft
Est. Value
About This Home
This home is located at 2221 University Blvd, Chickasha, OK 73018 and is currently estimated at $201,148, approximately $142 per square foot. 2221 University Blvd is a home located in Grady County with nearby schools including Grand Avenue Elementary School, Chickasha Middle School, and Lincoln Elementary School.
Ownership History
Date
Name
Owned For
Owner Type
Purchase Details
Closed on
Mar 22, 2024
Sold by
Smith Mark H
Bought by
Mark H Smith Living Trust and Smith
Current Estimated Value
Purchase Details
Closed on
Jul 25, 2012
Sold by
Loughat Michael D and Loughat Kristi J
Bought by
Smith Mark H
Purchase Details
Closed on
Jul 21, 2006
Sold by
Hendricks David and Hendricks Debbie
Bought by
Longhat Micheal D and Longhat Kristi J
Purchase Details
Closed on
Dec 29, 2003
Sold by
Chickasha Bank & Trust
Bought by
Hendricks David
Home Financials for this Owner
Home Financials are based on the most recent Mortgage that was taken out on this home.
Original Mortgage
$89,032
Interest Rate
7%
Mortgage Type
Future Advance Clause Open End Mortgage
Purchase Details
Closed on
Jan 2, 2002
Sold by
Johnson Milo Mike
Bought by
Chickasha Bank
Create a Home Valuation Report for This Property
The Home Valuation Report is an in-depth analysis detailing your home's value as well as a comparison with similar homes in the area
Home Values in the Area
Average Home Value in this Area
Purchase History
| Date | Buyer | Sale Price | Title Company |
|---|---|---|---|
| Mark H Smith Living Trust | -- | None Listed On Document | |
| Smith Mark H | -- | None Available | |
| Longhat Micheal D | $111,000 | None Available | |
| Hendricks David | $10,000 | -- | |
| Chickasha Bank | -- | -- |
Source: Public Records
Mortgage History
| Date | Status | Borrower | Loan Amount |
|---|---|---|---|
| Previous Owner | Hendricks David | $89,032 |
Source: Public Records
Tax History Compared to Growth
Tax History
| Year | Tax Paid | Tax Assessment Tax Assessment Total Assessment is a certain percentage of the fair market value that is determined by local assessors to be the total taxable value of land and additions on the property. | Land | Improvement |
|---|---|---|---|---|
| 2025 | $1,448 | $16,276 | $1,034 | $15,242 |
| 2024 | $1,448 | $15,280 | $971 | $14,309 |
| 2023 | $1,448 | $14,835 | $1,034 | $13,801 |
| 2022 | $1,394 | $14,403 | $1,034 | $13,369 |
| 2021 | $1,359 | $14,518 | $1,034 | $13,484 |
| 2020 | $1,419 | $14,785 | $1,034 | $13,751 |
| 2019 | $1,359 | $14,448 | $1,021 | $13,427 |
| 2018 | $1,341 | $14,027 | $964 | $13,063 |
| 2017 | $1,306 | $13,618 | $954 | $12,664 |
| 2016 | $1,276 | $13,222 | $917 | $12,305 |
| 2015 | $1,200 | $12,837 | $875 | $11,962 |
| 2014 | $1,200 | $12,463 | $820 | $11,643 |
Source: Public Records
Map
Nearby Homes
- 2210 Lakewood Dr
- 2305 Lakewood Dr
- 3400 W Mississippi Ave
- 3208 California Ave
- 2412 S 30th St
- 2801 S 27th Ct
- 2812 Scissortail Dr
- 2328 S 27th Ct
- 2401 S 28th Terrace
- 2821 S 27th Ct
- 2329 S 28th Terrace
- 2825 S 27th Ct
- 2329 S 27th Ct
- 2805 S 27th Ct
- 2817 S 27th Ct
- 2808 Scissortail Dr
- 2400 S 27th Ct
- 2409 S 27th Ct
- 2405 S 28th Terrace
- 2325 S 28th Terrace
- 2219 University Blvd
- 2225 University Blvd
- 2223 University Blvd
- 2217 University Blvd
- 2609 Lakewood Dr
- 2611 Lakewood Dr
- 2215 University Blvd
- 2224 University Blvd
- 2607 Lakewood Dr
- 2222 University Blvd
- 2216 University Blvd
- 2613 Lakewood Dr
- 2218 University Blvd
- 2213 University Blvd
- 2214 University Blvd
- 2605 Lakewood Dr
- 2606 Lakewood Dr
- 2211 University Blvd
- 2212 University Blvd
- 2610 Lakewood Dr