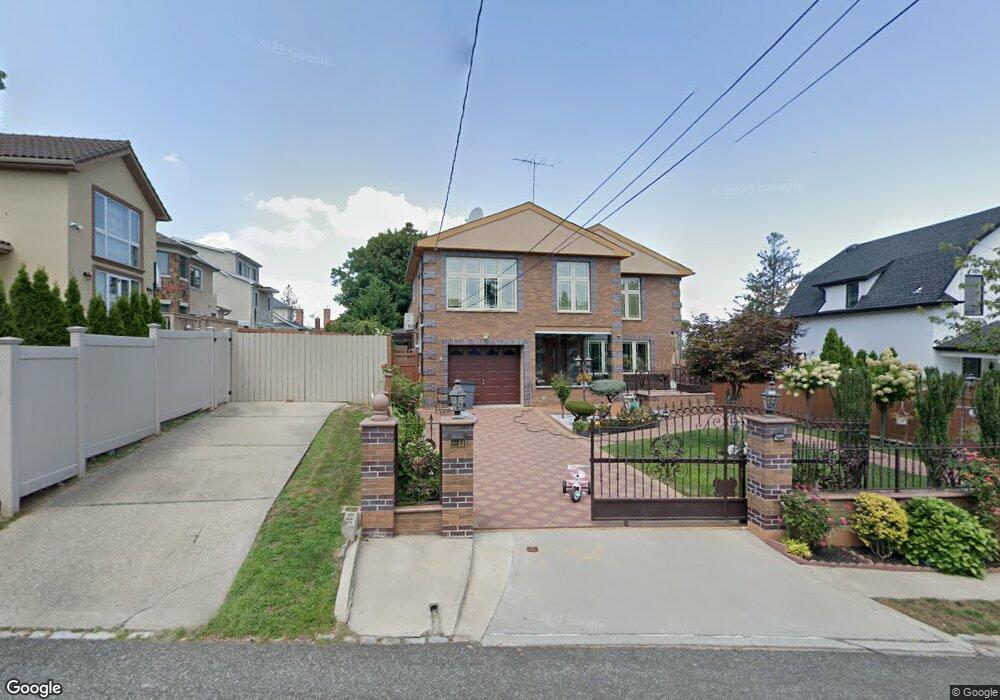
22211 39th Ave Bayside, NY 11361
Bayside NeighborhoodEstimated Value: $1,422,000 - $1,700,000
--
Bed
--
Bath
2,393
Sq Ft
$652/Sq Ft
Est. Value
About This Home
This home is located at 22211 39th Ave, Bayside, NY 11361 and is currently estimated at $1,561,333, approximately $652 per square foot. 22211 39th Ave is a home located in Queens County with nearby schools including P.S. 41 - Crocheron, M.S. 158 - Marie Curie, and Bayside High School.
Ownership History
Date
Name
Owned For
Owner Type
Purchase Details
Closed on
Feb 1, 2021
Sold by
Khosdal Waheed Ullah
Bought by
Khosdal Ruyhana and Khosdal Waheed Ullah
Current Estimated Value
Purchase Details
Closed on
Dec 22, 2010
Sold by
Xu Rong and Zhao Liang
Bought by
Khosdal Waheed Ullah and Khoshdal Sadiq Ullah
Home Financials for this Owner
Home Financials are based on the most recent Mortgage that was taken out on this home.
Original Mortgage
$425,000
Outstanding Balance
$280,740
Interest Rate
4.37%
Mortgage Type
Purchase Money Mortgage
Estimated Equity
$1,280,593
Purchase Details
Closed on
Aug 3, 2001
Sold by
Mehran Robert and Mehran Rosalie
Bought by
Zhao Liang and Xu Rong
Home Financials for this Owner
Home Financials are based on the most recent Mortgage that was taken out on this home.
Original Mortgage
$250,000
Interest Rate
6.91%
Mortgage Type
Purchase Money Mortgage
Create a Home Valuation Report for This Property
The Home Valuation Report is an in-depth analysis detailing your home's value as well as a comparison with similar homes in the area
Home Values in the Area
Average Home Value in this Area
Purchase History
| Date | Buyer | Sale Price | Title Company |
|---|---|---|---|
| Khosdal Ruyhana | -- | -- | |
| Khosdal Ruyhana | -- | -- | |
| Khosdal Ruyhana | -- | -- | |
| Khosdal Waheed Ullah | $850,000 | -- | |
| Khosdal Waheed Ullah | $850,000 | -- | |
| Zhao Liang | -- | -- | |
| Zhao Liang | -- | -- |
Source: Public Records
Mortgage History
| Date | Status | Borrower | Loan Amount |
|---|---|---|---|
| Open | Khosdal Waheed Ullah | $425,000 | |
| Closed | Khosdal Waheed Ullah | $425,000 | |
| Previous Owner | Zhao Liang | $250,000 |
Source: Public Records
Tax History Compared to Growth
Tax History
| Year | Tax Paid | Tax Assessment Tax Assessment Total Assessment is a certain percentage of the fair market value that is determined by local assessors to be the total taxable value of land and additions on the property. | Land | Improvement |
|---|---|---|---|---|
| 2025 | $15,648 | $80,220 | $15,907 | $64,313 |
| 2024 | $15,660 | $79,310 | $14,629 | $64,681 |
| 2023 | $14,971 | $75,938 | $14,802 | $61,136 |
| 2022 | $14,253 | $71,640 | $15,660 | $55,980 |
| 2021 | $13,209 | $76,620 | $15,660 | $60,960 |
| 2020 | $13,918 | $77,640 | $15,660 | $61,980 |
| 2019 | $13,533 | $82,200 | $15,660 | $66,540 |
| 2018 | $12,708 | $63,801 | $13,174 | $50,627 |
| 2017 | $11,306 | $56,934 | $12,250 | $44,684 |
| 2016 | $10,428 | $56,934 | $12,250 | $44,684 |
| 2015 | $6,258 | $53,712 | $16,431 | $37,281 |
| 2014 | $6,258 | $52,200 | $17,400 | $34,800 |
Source: Public Records
Map
Nearby Homes
- 40-25 221st St
- 221-10 41st Rd
- 38-16 220th St
- 219-08 38th Ave
- 3611 221st St
- 217-19 39th Ave
- 21820 36th Ave
- 35-26 221st St
- 35-22 221st St
- 43-27 220th St
- 39-09 216th St
- 38-29 216th St
- 218-12 43rd Ave Unit 2E
- 36-26 217th St
- 4218 217th St
- 220-55 46th Ave Unit 12K
- 220-55 46th Ave Unit 16K
- 220-55 46th Ave Unit 15T
- 220-55 46th Ave Unit 5P
- 220-55 46th Ave Unit 8A