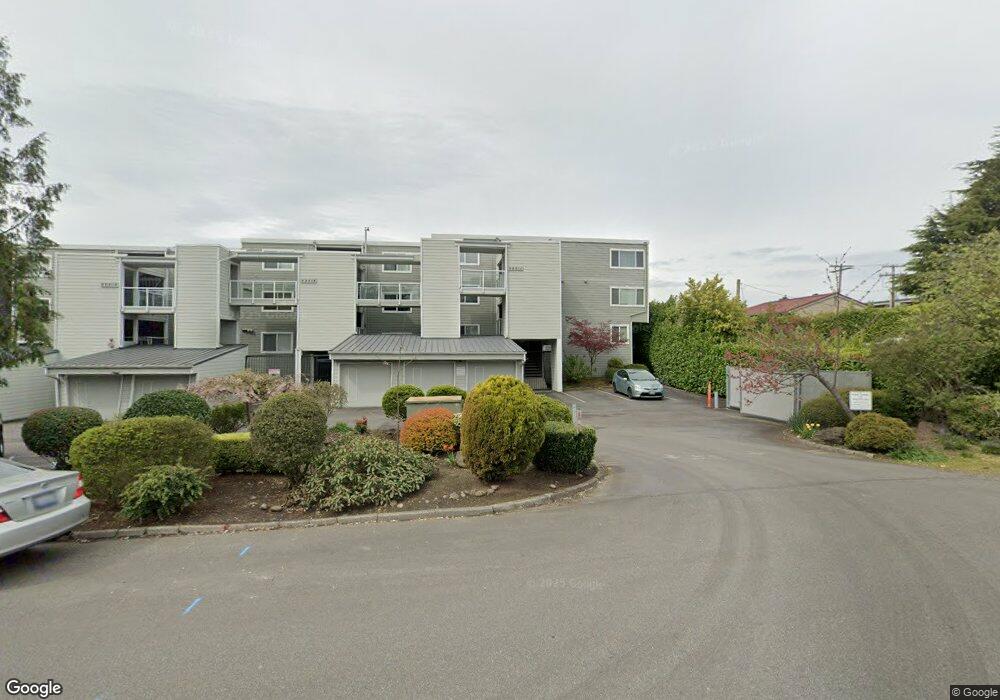
22211 6th Ave S Unit 110 Des Moines, WA 98198
Central Des Moines NeighborhoodEstimated Value: $354,000 - $446,000
2
Beds
2
Baths
1,110
Sq Ft
$371/Sq Ft
Est. Value
About This Home
This home is located at 22211 6th Ave S Unit 110, Des Moines, WA 98198 and is currently estimated at $411,488, approximately $370 per square foot. 22211 6th Ave S Unit 110 is a home located in King County with nearby schools including Des Moines Elementary School, Pacific Middle School, and Mount Rainier High School.
Ownership History
Date
Name
Owned For
Owner Type
Purchase Details
Closed on
Nov 17, 2022
Sold by
Hagen Edward A and Hagen Deborah
Bought by
Masri Barbara
Current Estimated Value
Purchase Details
Closed on
Apr 1, 2013
Sold by
Mcmonagle Catherine Sue
Bought by
Hagen Edward A
Home Financials for this Owner
Home Financials are based on the most recent Mortgage that was taken out on this home.
Original Mortgage
$139,000
Interest Rate
2.74%
Mortgage Type
New Conventional
Purchase Details
Closed on
Sep 16, 2005
Sold by
Fischer Albert and Fischer Terry Elaine
Bought by
Mcmonagle Catherine S
Purchase Details
Closed on
May 25, 2000
Sold by
Brody Fred O and Brody Norma Marie
Bought by
Fischer Albert and Fischer Terry Elaine
Home Financials for this Owner
Home Financials are based on the most recent Mortgage that was taken out on this home.
Original Mortgage
$140,650
Interest Rate
8.08%
Mortgage Type
FHA
Create a Home Valuation Report for This Property
The Home Valuation Report is an in-depth analysis detailing your home's value as well as a comparison with similar homes in the area
Home Values in the Area
Average Home Value in this Area
Purchase History
| Date | Buyer | Sale Price | Title Company |
|---|---|---|---|
| Masri Barbara | $372,000 | Equity Title | |
| Hagen Edward A | $189,000 | Cw Title Co | |
| Mcmonagle Catherine S | $245,000 | Lawyers Title | |
| Fischer Albert | $145,000 | Washington Title |
Source: Public Records
Mortgage History
| Date | Status | Borrower | Loan Amount |
|---|---|---|---|
| Previous Owner | Hagen Edward A | $139,000 | |
| Previous Owner | Fischer Albert | $140,650 |
Source: Public Records
Tax History Compared to Growth
Tax History
| Year | Tax Paid | Tax Assessment Tax Assessment Total Assessment is a certain percentage of the fair market value that is determined by local assessors to be the total taxable value of land and additions on the property. | Land | Improvement |
|---|---|---|---|---|
| 2024 | $4,534 | $358,000 | $34,900 | $323,100 |
| 2023 | $3,864 | $401,000 | $28,500 | $372,500 |
| 2022 | $3,834 | $349,000 | $23,200 | $325,800 |
| 2021 | $4,027 | $304,000 | $21,100 | $282,900 |
| 2020 | $3,667 | $303,000 | $21,100 | $281,900 |
| 2018 | $3,440 | $239,000 | $21,100 | $217,900 |
| 2017 | $2,956 | $238,000 | $21,100 | $216,900 |
| 2016 | $3,064 | $206,000 | $21,100 | $184,900 |
| 2015 | $2,686 | $218,000 | $17,900 | $200,100 |
| 2014 | -- | $188,000 | $17,900 | $170,100 |
| 2013 | -- | $119,000 | $17,900 | $101,100 |
Source: Public Records
Map
Nearby Homes
- 22218 5th Ave S Unit 101
- 22215 6th Ave S Unit 106
- 22222 Dock Ave S Unit 1C
- 22226 6th Ave S Unit 206
- 22226 6th Ave S Unit 201
- 21937 7th Ave S Unit B213
- 22315 6th Ave S Unit A109
- 21833 7th Ave S
- 212 S 219th St
- 161 S 216th St
- 813 S 227th Place Unit 5
- 21419 3rd Ave S
- 22977 Marine View Dr S Unit C104
- 21216 Des Moines Memorial Dr S
- 1208 S 216th St Unit D201
- 1020 S 230th St Unit 307B
- 21845 15th Ave S
- 1508 S 223rd St
- 21024 5th Ave S
- 21634 14th Ave S Unit C-4
- 22211 6th Ave S Unit 112
- 22211 6th Ave S Unit 311
- 22211 6th Ave S Unit 205
- 22211 6th Ave S Unit 104
- 22211 6th Ave S Unit 105
- 22211 6th Ave S Unit 306
- 22211 6th Ave S Unit 101
- 22211 6th Ave S Unit 209
- 22211 6th Ave S Unit 2312
- 22211 6th Ave S Unit 301
- 22211 6th Ave S Unit 201
- 22211 6th Ave S Unit 203
- 22211 6th Ave S Unit 107
- 22211 6th Ave S Unit 309
- 22211 6th Ave S Unit 102
- 22211 6th Ave S Unit 305
- 22211 6th Ave S Unit 212
- 22211 6th Ave S Unit 2112
- 22211 6th Ave S Unit 302
- 22211 6th Ave S Unit 206