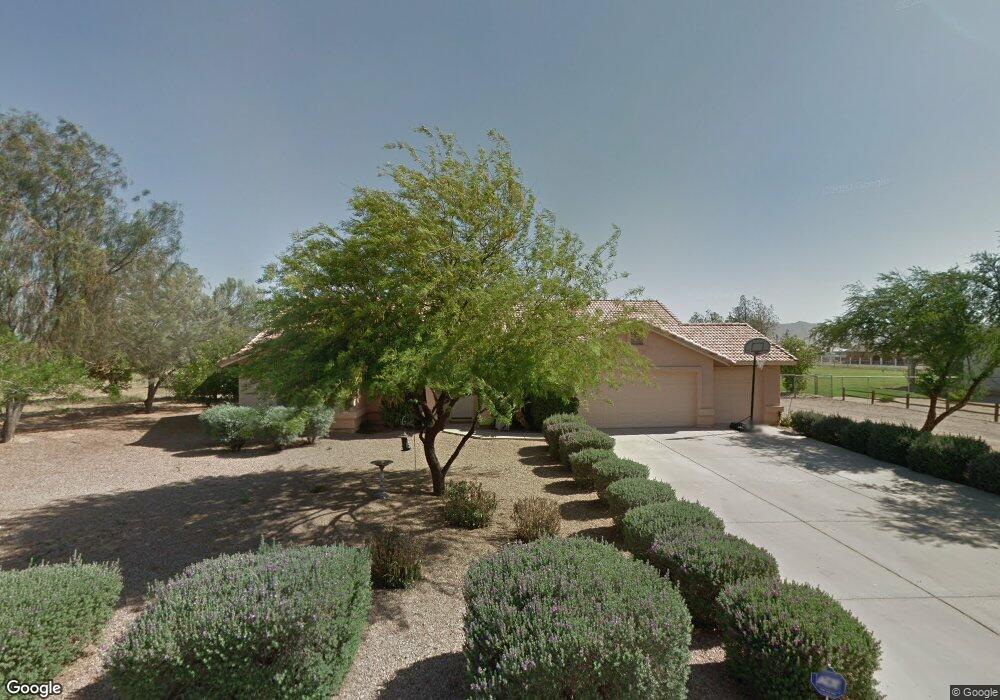
22213 E Vallejo St Queen Creek, AZ 85142
Estimated Value: $652,777 - $706,000
Studio
2
Baths
2,000
Sq Ft
$336/Sq Ft
Est. Value
About This Home
This home is located at 22213 E Vallejo St, Queen Creek, AZ 85142 and is currently estimated at $671,444, approximately $335 per square foot. 22213 E Vallejo St is a home located in Maricopa County with nearby schools including Schnepf Elementary School, Newell Barney Middle School, and Crismon High School.
Ownership History
Date
Name
Owned For
Owner Type
Purchase Details
Closed on
Jan 14, 1998
Sold by
Alc Builders Inc
Bought by
Crewse Patrick R and Crewse Shelly D
Current Estimated Value
Home Financials for this Owner
Home Financials are based on the most recent Mortgage that was taken out on this home.
Original Mortgage
$127,400
Outstanding Balance
$22,091
Interest Rate
7.13%
Mortgage Type
New Conventional
Estimated Equity
$649,353
Purchase Details
Closed on
Sep 24, 1997
Sold by
South Creek Ranch Llc
Bought by
Alc Builders Inc
Purchase Details
Closed on
Jul 23, 1997
Sold by
Pryor William and Pryor Brenda
Bought by
Crewse Patrick R and Crewse Shelly D
Purchase Details
Closed on
Jul 11, 1997
Sold by
Rodriguez Veronica Marie and Rodriguez Michael Bruce
Bought by
Crewse Patrick R and Crewse Shelly D
Create a Home Valuation Report for This Property
The Home Valuation Report is an in-depth analysis detailing your home's value as well as a comparison with similar homes in the area
Purchase History
| Date | Buyer | Sale Price | Title Company |
|---|---|---|---|
| Crewse Patrick R | $158,400 | Transnation Title Ins Co | |
| Alc Builders Inc | -- | Transnation Title Ins Co | |
| Crewse Patrick R | -- | Grand Canyon Title Agency In | |
| Crewse Patrick R | -- | Grand Canyon Title Agency In | |
| Crewse Patrick R | -- | Grand Canyon Title Agency In |
Source: Public Records
Mortgage History
| Date | Status | Borrower | Loan Amount |
|---|---|---|---|
| Open | Crewse Patrick R | $127,400 |
Source: Public Records
Tax History
| Year | Tax Paid | Tax Assessment Tax Assessment Total Assessment is a certain percentage of the fair market value that is determined by local assessors to be the total taxable value of land and additions on the property. | Land | Improvement |
|---|---|---|---|---|
| 2025 | $2,867 | $29,387 | -- | -- |
| 2024 | $2,884 | $27,988 | -- | -- |
| 2023 | $2,884 | $53,400 | $10,680 | $42,720 |
| 2022 | $2,701 | $40,550 | $8,110 | $32,440 |
| 2021 | $2,761 | $34,680 | $6,930 | $27,750 |
| 2020 | $2,734 | $32,120 | $6,420 | $25,700 |
| 2019 | $3,262 | $29,780 | $5,950 | $23,830 |
| 2018 | $3,017 | $28,510 | $5,700 | $22,810 |
| 2017 | $2,938 | $26,560 | $5,310 | $21,250 |
| 2016 | $2,776 | $25,210 | $5,040 | $20,170 |
| 2015 | $2,652 | $24,630 | $4,920 | $19,710 |
Source: Public Records
Map
Nearby Homes
- 22226 E Misty Ct
- 24824 S Signal Butte Rd
- 22377 E Sentiero Dr
- 22326 E Sentiero Dr
- 21961 E Via de Arboles
- 22445 E Marsh Rd
- 22481 E Pecan Ln
- 22251 E Via de Olivos Ct
- 22561 E Sentiero Ct
- 22186 E Creekside Dr
- 22508 E Lawndale Place
- 22609 E Marsh Rd
- 22069 E Pecan Dr
- 22218 E Cherrywood Dr
- 25588 S 224th Place
- 22593 E Indiana Ave
- 21778 E Via de Arboles
- 22682 E Indiana Ave
- 22355 E Vía Del Palo
- 22630 E Lawndale Place
- 22225 E Vallejo St
- 22200 E Vallejo St
- 22212 E Vallejo St
- 22237 E Vallejo St
- 22224 E Vallejo St
- 208 W Danish Rd
- 0 S 222 St Unit 6336843
- 0 S 222 St
- 24705 222nd St
- 22126 E Cedar Waxwing Dr
- 22236 E Vallejo St
- 24711 S 222nd St
- 24523 S 221st Place
- 22301 E Vallejo St
- 22300 E Vallejo St
- 22109 E Cedar Waxwing Dr
- 24706 S 223rd Place
- 00000 N 223 Place Unit 304-92-061g
- 24509 S 221st Place
- 0 E Cedar Waxwing Dr
Your Personal Tour Guide
Ask me questions while you tour the home.