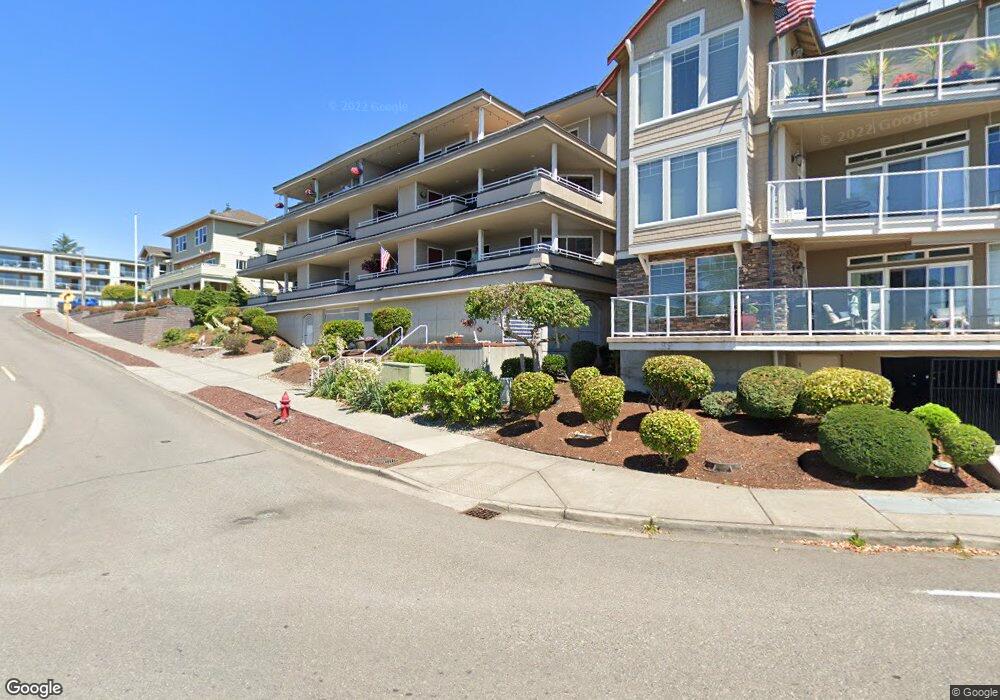
22218 Cliff Ave S Unit 204 Des Moines, WA 98198
Central Des Moines NeighborhoodEstimated Value: $760,000 - $952,000
2
Beds
2
Baths
1,611
Sq Ft
$534/Sq Ft
Est. Value
About This Home
This home is located at 22218 Cliff Ave S Unit 204, Des Moines, WA 98198 and is currently estimated at $860,485, approximately $534 per square foot. 22218 Cliff Ave S Unit 204 is a home located in King County with nearby schools including Des Moines Elementary School, Pacific Middle School, and Mount Rainier High School.
Ownership History
Date
Name
Owned For
Owner Type
Purchase Details
Closed on
Jul 13, 2017
Sold by
Labelle Kenneth R and Labelle Priscilla M
Bought by
Hopps Clifford and Hopps Rachel
Current Estimated Value
Purchase Details
Closed on
May 15, 2013
Sold by
Noble Catherine and Short Deborah
Bought by
Labelle Kenneth R and Labelle Pricilla M
Home Financials for this Owner
Home Financials are based on the most recent Mortgage that was taken out on this home.
Original Mortgage
$356,000
Interest Rate
3.37%
Mortgage Type
New Conventional
Purchase Details
Closed on
May 10, 1999
Sold by
Diem Gustav and Diem Janice J
Bought by
Knee Norman and Knee Helen S
Home Financials for this Owner
Home Financials are based on the most recent Mortgage that was taken out on this home.
Original Mortgage
$125,000
Interest Rate
6.94%
Mortgage Type
Seller Take Back
Create a Home Valuation Report for This Property
The Home Valuation Report is an in-depth analysis detailing your home's value as well as a comparison with similar homes in the area
Home Values in the Area
Average Home Value in this Area
Purchase History
| Date | Buyer | Sale Price | Title Company |
|---|---|---|---|
| Hopps Clifford | $685,000 | First American Title Ins Co | |
| Labelle Kenneth R | $445,000 | First American | |
| Knee Norman | $410,000 | Transnation Title Insurance |
Source: Public Records
Mortgage History
| Date | Status | Borrower | Loan Amount |
|---|---|---|---|
| Previous Owner | Labelle Kenneth R | $356,000 | |
| Previous Owner | Knee Norman | $125,000 |
Source: Public Records
Tax History Compared to Growth
Tax History
| Year | Tax Paid | Tax Assessment Tax Assessment Total Assessment is a certain percentage of the fair market value that is determined by local assessors to be the total taxable value of land and additions on the property. | Land | Improvement |
|---|---|---|---|---|
| 2024 | $8,226 | $705,000 | $64,500 | $640,500 |
| 2023 | $7,716 | $788,000 | $51,600 | $736,400 |
| 2022 | $7,731 | $708,000 | $46,400 | $661,600 |
| 2021 | $7,989 | $622,000 | $46,400 | $575,600 |
| 2020 | $9,136 | $609,000 | $46,400 | $562,600 |
| 2018 | $7,417 | $556,000 | $46,400 | $509,600 |
| 2017 | $7,132 | $520,000 | $46,400 | $473,600 |
| 2016 | $7,436 | $505,000 | $46,400 | $458,600 |
| 2015 | $7,368 | $537,000 | $46,400 | $490,600 |
| 2014 | -- | $498,000 | $46,400 | $451,600 |
| 2013 | -- | $414,000 | $33,500 | $380,500 |
Source: Public Records
Map
Nearby Homes
- 22218 5th Ave S Unit 101
- 22215 6th Ave S Unit 106
- 22222 Dock Ave S Unit 1C
- 506 S 222nd St Unit 1
- 22226 6th Ave S Unit 201
- 22315 6th Ave S Unit A109
- 21937 7th Ave S Unit B213
- 21833 7th Ave S
- 212 S 219th St
- 161 S 216th St
- 21419 3rd Ave S
- 1020 S 230th St Unit 307B
- 1020 S 230th St Unit B108
- 304 S 213th St
- 21216 Des Moines Memorial Dr S
- 1208 S 216th St Unit D201
- 21845 15th Ave S
- 1508 S 223rd St
- 21024 5th Ave S
- 1251 S 230th St
- 22218 5th Ave S Unit 201
- 22218 5th Ave S Unit 202
- 22218 5th Ave S Unit 203
- 22218 5th Ave S Unit 103
- 22218 5th Ave S Unit 301
- 22218 Cliff Ave S Unit 301
- 22218 Cliff Ave S Unit 202
- 22218 Cliff Ave S Unit 103
- 22218 Cliff Ave S Unit 302
- 22218 Cliff Ave S Unit 102
- 22218 Cliff Ave S Unit 104
- 22218 Cliff Ave S Unit 201
- 22218 Cliff Ave S Unit 203
- 22218 Cliff Ave S Unit 101
- 22218 5th Ave S Unit 204
- 20405 5th Ave S
- 509 S 222nd St
- 22213 6th Ave S Unit 303
- 22213 6th Ave S Unit 304
- 22213 6th Ave S Unit 203