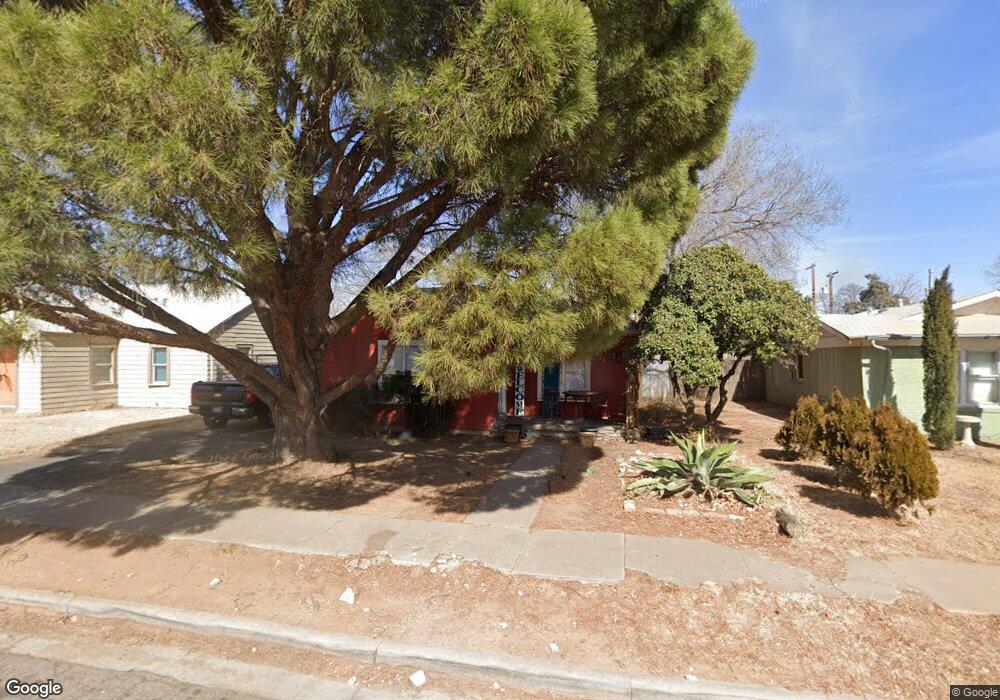
2222 28th St Lubbock, TX 79411
Heart of Lubbock NeighborhoodEstimated Value: $109,000 - $124,000
2
Beds
1
Bath
982
Sq Ft
$117/Sq Ft
Est. Value
About This Home
This home is located at 2222 28th St, Lubbock, TX 79411 and is currently estimated at $115,281, approximately $117 per square foot. 2222 28th St is a home located in Lubbock County with nearby schools including Dupre Elementary School, Brown Elementary School, and Slaton Middle School.
Ownership History
Date
Name
Owned For
Owner Type
Purchase Details
Closed on
Apr 25, 2016
Sold by
Swinburn Derek D
Bought by
Swinburn Scot
Current Estimated Value
Purchase Details
Closed on
May 22, 2006
Sold by
Young Patricia S
Bought by
Swinburn Derek Dane
Home Financials for this Owner
Home Financials are based on the most recent Mortgage that was taken out on this home.
Original Mortgage
$40,000
Interest Rate
6.4%
Mortgage Type
New Conventional
Purchase Details
Closed on
Aug 29, 1996
Sold by
Hart Stephen Paul
Bought by
Swinburn Scot
Create a Home Valuation Report for This Property
The Home Valuation Report is an in-depth analysis detailing your home's value as well as a comparison with similar homes in the area
Home Values in the Area
Average Home Value in this Area
Purchase History
| Date | Buyer | Sale Price | Title Company |
|---|---|---|---|
| Swinburn Scot | -- | -- | |
| Swinburn Derek Dane | -- | None Available | |
| Swinburn Scot | -- | -- |
Source: Public Records
Mortgage History
| Date | Status | Borrower | Loan Amount |
|---|---|---|---|
| Previous Owner | Swinburn Derek Dane | $40,000 |
Source: Public Records
Tax History Compared to Growth
Tax History
| Year | Tax Paid | Tax Assessment Tax Assessment Total Assessment is a certain percentage of the fair market value that is determined by local assessors to be the total taxable value of land and additions on the property. | Land | Improvement |
|---|---|---|---|---|
| 2025 | $2,178 | $106,348 | $25,000 | $81,348 |
| 2024 | $2,178 | $123,213 | $25,000 | $98,213 |
| 2023 | $1,858 | $99,959 | $13,650 | $86,309 |
| 2022 | $1,893 | $93,510 | $13,650 | $79,860 |
| 2021 | $1,528 | $71,369 | $13,650 | $57,719 |
| 2020 | $1,572 | $72,271 | $13,650 | $58,621 |
| 2019 | $1,420 | $63,253 | $13,650 | $49,603 |
| 2018 | $1,473 | $65,507 | $13,650 | $51,857 |
| 2017 | $1,280 | $56,862 | $2,750 | $54,112 |
| 2016 | $1,219 | $54,156 | $2,750 | $51,406 |
| 2015 | $1,122 | $53,314 | $2,750 | $50,564 |
| 2014 | $1,122 | $50,445 | $2,750 | $47,695 |
Source: Public Records
Map
Nearby Homes