C
Seller's Agent in 2019
Colleen Sherlock
Greenwood King Properties - Kirby Office
(713) 858-6699
40 in this area
286 Total Sales

Estimated Value: $2,518,000 - $3,753,000
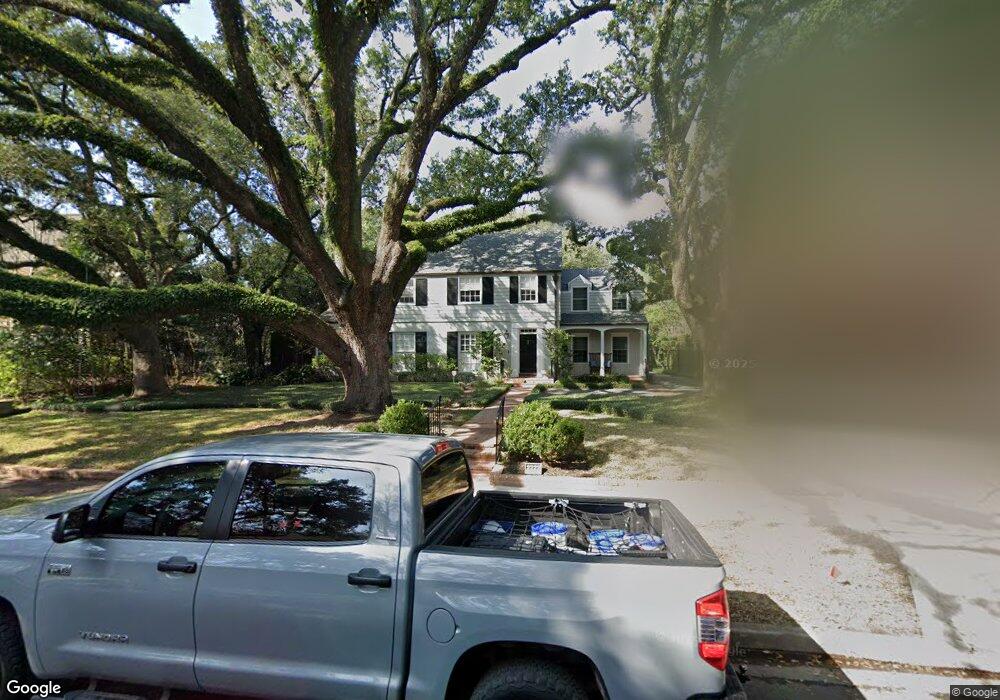
A Soaring, illuminated, Oak Tree that has been carefully preserved guides the way to this Hiram Salisbury Classic. The main house is comprised of 4-bedrooms 4,052 (appraisal) sq ft w/ guest house providing 1,093.81 (appraisal) add'l sq ft. Current owners hired Richard Ball, Marshall Porterfield & D L Doyle Construction to elevate & modernize the home while staying true to its original style. Extensive remodel in 2002 & 2006 includes walk-in Master Closet, Master Bath, lovely Island Kitchen w/honed marble countertops, SS appliances, walk-in pantry, Breakfast area, coffee bar, wet bar, butler pantry & Den. 2- story guest house and garage added/renovated w/ first floor utility room, living rm and 1/2 bath. 2nd floor guest suite includes kitchenette, full bath & elevator capable closet. Main house formals have remained original including Living, Library, Sunroom & Dining. This peaceful retreat features clean lines and a sophisticated color palette w/ dreamy garden views. All per Seller
Last Agent to Sell the Property
Greenwood King Properties - Kirby Office License #0217959 Listed on: 03/06/2019
Last Buyer's Agent
Irma Jalifi
Redfin Corporation License #0444725
| Date | Buyer | Sale Price | Title Company |
|---|---|---|---|
| Foley Aaron | -- | Old Republic Natl Ttl Ins Co | |
| Morris William D | -- | -- |
| Date | Status | Borrower | Loan Amount |
|---|---|---|---|
| Open | Foley Aaron | $1,707,500 | |
| Previous Owner | Morris William D | $440,950 |
| Date | Event | Price | List to Sale | Price per Sq Ft |
|---|---|---|---|---|
| 12/31/2021 12/31/21 | Off Market | -- | -- | -- |
| 05/22/2019 05/22/19 | Sold | -- | -- | -- |
| 04/22/2019 04/22/19 | Pending | -- | -- | -- |
| 03/06/2019 03/06/19 | For Sale | $2,350,000 | -- | $580 / Sq Ft |
| Year | Tax Paid | Tax Assessment Tax Assessment Total Assessment is a certain percentage of the fair market value that is determined by local assessors to be the total taxable value of land and additions on the property. | Land | Improvement |
|---|---|---|---|---|
| 2025 | $42,356 | $3,661,400 | $2,014,380 | $1,647,020 |
| 2024 | $42,356 | $2,427,866 | $1,884,420 | $543,446 |
| 2023 | $42,356 | $2,662,388 | $1,819,440 | $842,948 |
| 2022 | $52,845 | $2,400,000 | $1,689,480 | $710,520 |
| 2021 | $52,631 | $2,258,200 | $1,624,500 | $633,700 |
| 2020 | $54,540 | $2,252,226 | $1,624,500 | $627,726 |
| 2019 | $56,530 | $2,234,000 | $1,624,500 | $609,500 |
| 2018 | $42,923 | $2,124,700 | $1,689,480 | $435,220 |
| 2017 | $52,587 | $2,124,700 | $1,689,480 | $435,220 |
| 2016 | $47,806 | $2,000,000 | $1,624,500 | $375,500 |
| 2015 | $32,121 | $1,962,828 | $1,374,780 | $588,048 |
| 2014 | $32,121 | $1,650,000 | $1,249,800 | $400,200 |
C
Seller's Agent in 2019
Colleen Sherlock
Greenwood King Properties - Kirby Office
(713) 858-6699
40 in this area
286 Total Sales
I
Buyer's Agent in 2019
Irma Jalifi
Redfin Corporation
Source: Houston Association of REALTORS®
MLS Number: 879145
APN: 0601530350014
Disclaimer: Certain information contained herein is derived from information provided by parties other than Homes.com. All information provided is deemed reliable, but is not guaranteed to be accurate and should be independently verified.
![]() Copyright 2026, Houston REALTORS® Information Service, Inc.
Copyright 2026, Houston REALTORS® Information Service, Inc.
The information provided is exclusively for consumers’ personal, non-commercial use, and may not be used for any purpose other than to identify prospective properties consumers may be interested in purchasing.
Information is deemed reliable but not guaranteed.
Ask me questions while you tour the home.
