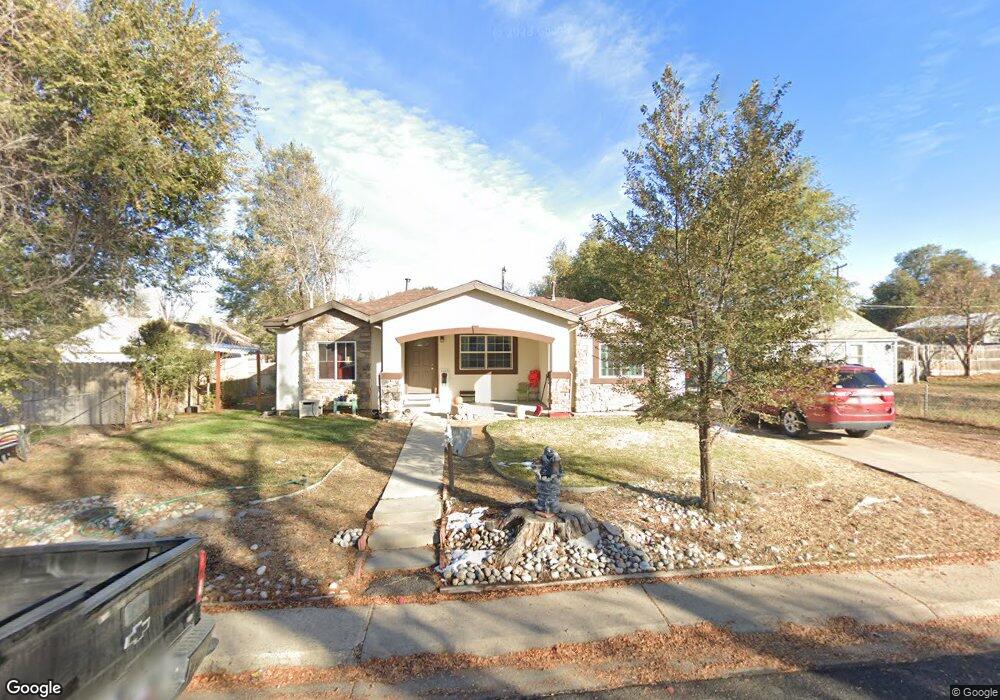
2222 Fulton St Aurora, CO 80010
North Aurora NeighborhoodEstimated Value: $365,456 - $425,000
3
Beds
1
Bath
1,066
Sq Ft
$369/Sq Ft
Est. Value
About This Home
This home is located at 2222 Fulton St, Aurora, CO 80010 and is currently estimated at $393,364, approximately $369 per square foot. 2222 Fulton St is a home located in Adams County with nearby schools including Lincoln Elementary School, North Middle School Health Sciences & Technology, and El Camino High School.
Ownership History
Date
Name
Owned For
Owner Type
Purchase Details
Closed on
Sep 22, 2000
Sold by
J S & B Investments Llc
Bought by
Vargas Luis Carlos
Current Estimated Value
Home Financials for this Owner
Home Financials are based on the most recent Mortgage that was taken out on this home.
Original Mortgage
$143,251
Interest Rate
7.97%
Mortgage Type
FHA
Purchase Details
Closed on
Sep 21, 2000
Sold by
Raymond Johnston
Bought by
J S & B Investments Llc
Home Financials for this Owner
Home Financials are based on the most recent Mortgage that was taken out on this home.
Original Mortgage
$143,251
Interest Rate
7.97%
Mortgage Type
FHA
Purchase Details
Closed on
Jan 19, 1996
Sold by
J S & B Investments Llc
Bought by
Johnston Raymond D
Purchase Details
Closed on
Jan 13, 1995
Sold by
Campton Cinda Lu
Bought by
Js & B Investments Llc
Purchase Details
Closed on
Dec 1, 1992
Create a Home Valuation Report for This Property
The Home Valuation Report is an in-depth analysis detailing your home's value as well as a comparison with similar homes in the area
Home Values in the Area
Average Home Value in this Area
Purchase History
| Date | Buyer | Sale Price | Title Company |
|---|---|---|---|
| Vargas Luis Carlos | $144,300 | Land Title Guarantee Company | |
| J S & B Investments Llc | -- | Land Title Guarantee Company | |
| Johnston Raymond D | -- | -- | |
| Js & B Investments Llc | $23,000 | Home Title Corporation | |
| -- | $35,000 | -- |
Source: Public Records
Mortgage History
| Date | Status | Borrower | Loan Amount |
|---|---|---|---|
| Previous Owner | Vargas Luis Carlos | $143,251 |
Source: Public Records
Tax History Compared to Growth
Tax History
| Year | Tax Paid | Tax Assessment Tax Assessment Total Assessment is a certain percentage of the fair market value that is determined by local assessors to be the total taxable value of land and additions on the property. | Land | Improvement |
|---|---|---|---|---|
| 2024 | $2,433 | $23,810 | $5,000 | $18,810 |
| 2023 | $2,472 | $26,930 | $5,210 | $21,720 |
| 2022 | $2,484 | $21,860 | $5,350 | $16,510 |
| 2021 | $2,588 | $21,860 | $5,350 | $16,510 |
| 2020 | $2,481 | $21,020 | $5,510 | $15,510 |
| 2019 | $2,476 | $21,020 | $5,510 | $15,510 |
| 2018 | $1,829 | $15,460 | $4,320 | $11,140 |
| 2017 | $1,625 | $15,460 | $4,320 | $11,140 |
| 2016 | $1,014 | $9,570 | $2,390 | $7,180 |
| 2015 | $982 | $9,570 | $2,390 | $7,180 |
| 2014 | -- | $8,870 | $1,910 | $6,960 |
Source: Public Records
Map
Nearby Homes
- 2226 Fulton St
- 2285 Fulton St
- 2060 Fulton St
- 2332 Galena St
- 2086 Elmira St
- 2097 Hanover St
- 2000 Elmira St
- 2086 Hanover St
- 2080 Emporia St
- 2356 Elmira St
- 2348 Emporia St
- 2356 Emporia St
- 1956 Elmira St
- 2028 Havana St
- 10159 E 25th Dr
- 2241 Ironton St
- 1746 Galena St
- 2064 Ironton St
- 9833 E 26th Ave Unit 9833
- 2626 Emporia St