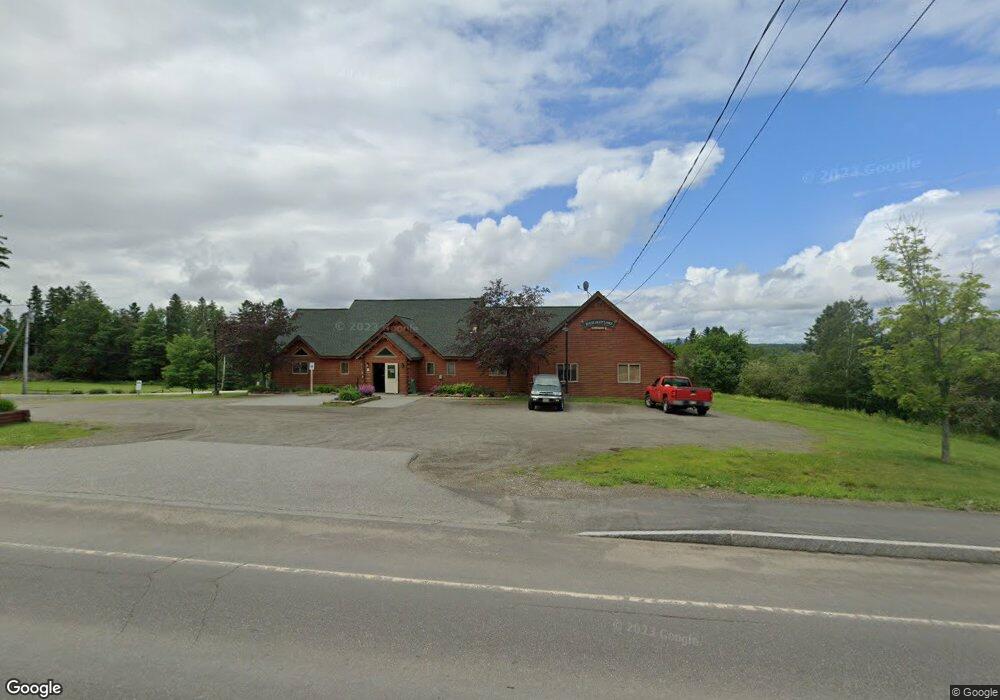
2222 Main St Rangeley, ME 04970
Estimated Value: $748,909 - $1,103,000
Studio
--
Bath
4,788
Sq Ft
$191/Sq Ft
Est. Value
About This Home
This home is located at 2222 Main St, Rangeley, ME 04970 and is currently estimated at $914,977, approximately $191 per square foot. 2222 Main St is a home with nearby schools including Rangeley Lakes Regional School.
Ownership History
Date
Name
Owned For
Owner Type
Purchase Details
Closed on
Feb 14, 2023
Sold by
Arsenault Mark S and Baker Cherry A
Bought by
Arsenault Abi and Card Kenneth
Current Estimated Value
Purchase Details
Closed on
Nov 25, 2022
Sold by
Bcm Nt
Bought by
Knof Kelsey
Purchase Details
Closed on
Jul 8, 2022
Sold by
Boatman Harvey C and Clark Dale M
Bought by
Morowski Robert
Purchase Details
Closed on
Feb 1, 2022
Sold by
Cote Daniel S and Cote Penellope J
Bought by
Austin Meredith and Austin David
Purchase Details
Closed on
Jan 6, 2022
Sold by
Tourigny Bruce A and Tourigny Susan B
Bought by
Susan B Tourigny Lt
Purchase Details
Closed on
May 10, 2021
Sold by
Wahrenberger Carolyn
Bought by
Poliquin Greg
Purchase Details
Closed on
Sep 8, 2014
Sold by
Kapsimalis William P and Kapsimalis Lorriane F
Bought by
Lee Barry and Dyer Kelly
Purchase Details
Closed on
Jan 25, 2010
Sold by
Bennett Jeffrey P
Bought by
Conway Kimberly
Purchase Details
Closed on
Dec 18, 2009
Sold by
Bennett Pauline H
Bought by
Bennett Jeffrey P
Create a Home Valuation Report for This Property
The Home Valuation Report is an in-depth analysis detailing your home's value as well as a comparison with similar homes in the area
Purchase History
| Date | Buyer | Sale Price | Title Company |
|---|---|---|---|
| Arsenault Abi | -- | None Available | |
| Knof Kelsey | -- | None Available | |
| Morowski Robert | $1,200 | None Available | |
| Austin Meredith | -- | None Available | |
| Susan B Tourigny Lt | -- | None Available | |
| Poliquin Greg | -- | None Available | |
| Lee Barry | -- | -- | |
| Conway Kimberly | -- | -- | |
| Bennett Jeffrey P | -- | -- |
Source: Public Records
Tax History
| Year | Tax Paid | Tax Assessment Tax Assessment Total Assessment is a certain percentage of the fair market value that is determined by local assessors to be the total taxable value of land and additions on the property. | Land | Improvement |
|---|---|---|---|---|
| 2024 | $6,137 | $501,800 | $78,600 | $423,200 |
| 2023 | $6,137 | $501,800 | $78,600 | $423,200 |
| 2022 | $5,405 | $358,900 | $56,600 | $302,300 |
| 2021 | $5,322 | $358,900 | $56,600 | $302,300 |
| 2020 | $4,967 | $358,900 | $56,600 | $302,300 |
| 2019 | $5,007 | $358,900 | $56,600 | $302,300 |
| 2018 | $4,845 | $358,900 | $56,600 | $302,300 |
| 2017 | $4,547 | $358,900 | $56,600 | $302,300 |
| 2016 | $4,278 | $358,900 | $56,600 | $302,300 |
| 2015 | $4,109 | $358,900 | $56,600 | $302,300 |
| 2014 | $4,145 | $358,900 | $56,600 | $302,300 |
| 2013 | $4,199 | $358,900 | $56,600 | $302,300 |
Source: Public Records
Map
Nearby Homes
- Lot 6 Eva D Ln
- Lot 4 Eva D Ln
- 1097 Main St
- M8 L1 - 8 Case Rd
- 2388 Main St
- 17 Moose Ridge Rd
- 42 Whip Willow Farm Rd Unit 17
- 42 Whip Willow Farm Rd Unit 19
- 40 Spring St
- 11 Whip Willow Farm Rd Unit 8
- 39 Kendall Farm Trail
- 11 High St
- 67 Harold Ross Rd
- 177 Dallas Hill Rd
- 19 Pleasant St Unit A
- 33 School St
- 11 Overlook Rd
- 157 Kendall Farm Trail
- 1972 Main St
- 44 Loon Lake Rd
- 2222 Main St Unit C
- C1 Cottage Ave
- 0 Cottage Ave C-13
- 2 Idlewood Dr Unit 2
- 4 Idlewood Cottage Unit 4
- 4 Idlewood Cottages Unit 4
- 19 Idlewood Dr
- 2223 Idlewood Dr Unit 3
- 20 Cottage Ave
- 2204 Idlewood Dr Unit 8
- 2204 Idlewood Dr Unit 9
- 12 Main St
- 10 Main St
- 2249 Main St
- 41 Grandview Ave
- 2268 Main St
- Lot 7 Eva D Ln
- Lot 1 Caddy
- 21 Caddy Dr Unit C21
- 18 Caddy Dr Unit 18C
Your Personal Tour Guide
Ask me questions while you tour the home.