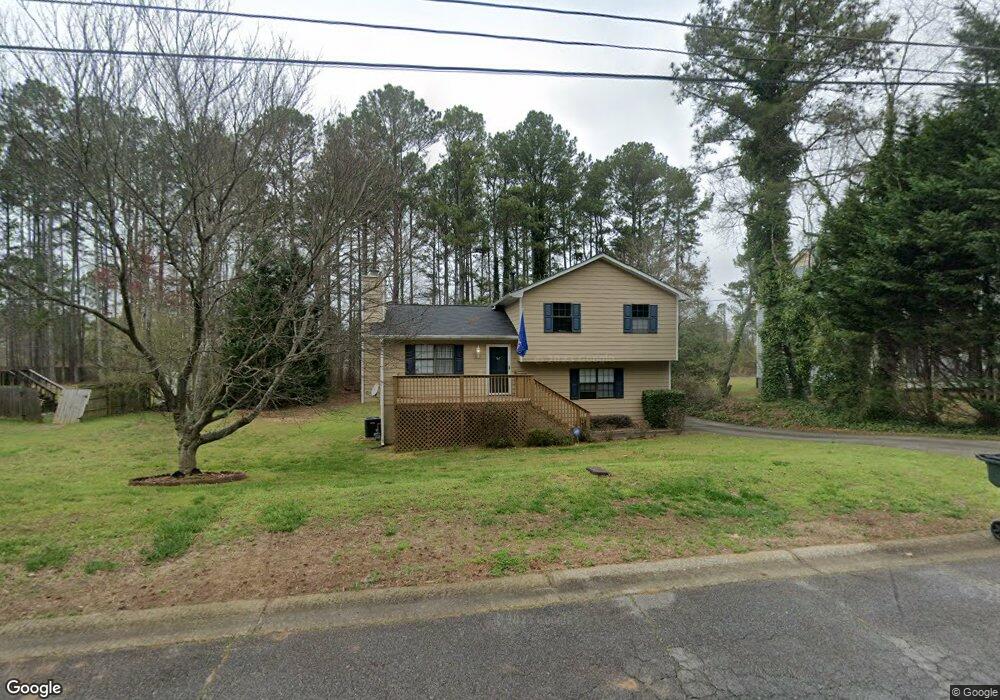
2222 Red Rose Ln Unit 1 Loganville, GA 30052
Estimated Value: $260,000 - $312,708
3
Beds
3
Baths
1,596
Sq Ft
$185/Sq Ft
Est. Value
About This Home
This home is located at 2222 Red Rose Ln Unit 1, Loganville, GA 30052 and is currently estimated at $295,427, approximately $185 per square foot. 2222 Red Rose Ln Unit 1 is a home located in Gwinnett County with nearby schools including Magill Elementary School, Grace Snell Middle School, and South Gwinnett High School.
Ownership History
Date
Name
Owned For
Owner Type
Purchase Details
Closed on
Aug 4, 2006
Sold by
Mazzola Barbara
Bought by
Lawson James N and Lawson Shannon W
Current Estimated Value
Home Financials for this Owner
Home Financials are based on the most recent Mortgage that was taken out on this home.
Original Mortgage
$131,000
Outstanding Balance
$78,308
Interest Rate
6.68%
Mortgage Type
New Conventional
Estimated Equity
$217,119
Purchase Details
Closed on
Sep 20, 2002
Sold by
Johnson Janet M
Bought by
Mazzola Barbara
Home Financials for this Owner
Home Financials are based on the most recent Mortgage that was taken out on this home.
Original Mortgage
$124,568
Interest Rate
6.19%
Mortgage Type
FHA
Purchase Details
Closed on
Aug 11, 2000
Sold by
Bires Dean L and Bires Melissa K
Bought by
Johnson Janet M
Home Financials for this Owner
Home Financials are based on the most recent Mortgage that was taken out on this home.
Original Mortgage
$91,900
Interest Rate
8%
Mortgage Type
New Conventional
Create a Home Valuation Report for This Property
The Home Valuation Report is an in-depth analysis detailing your home's value as well as a comparison with similar homes in the area
Home Values in the Area
Average Home Value in this Area
Purchase History
| Date | Buyer | Sale Price | Title Company |
|---|---|---|---|
| Lawson James N | $131,000 | -- | |
| Mazzola Barbara | $126,600 | -- | |
| Johnson Janet M | $114,900 | -- |
Source: Public Records
Mortgage History
| Date | Status | Borrower | Loan Amount |
|---|---|---|---|
| Open | Lawson James N | $131,000 | |
| Previous Owner | Mazzola Barbara | $124,568 | |
| Previous Owner | Johnson Janet M | $91,900 |
Source: Public Records
Tax History Compared to Growth
Tax History
| Year | Tax Paid | Tax Assessment Tax Assessment Total Assessment is a certain percentage of the fair market value that is determined by local assessors to be the total taxable value of land and additions on the property. | Land | Improvement |
|---|---|---|---|---|
| 2024 | $3,124 | $106,120 | $30,000 | $76,120 |
| 2023 | $3,124 | $120,920 | $29,680 | $91,240 |
| 2022 | $3,077 | $105,880 | $19,200 | $86,680 |
| 2021 | $2,432 | $73,360 | $14,000 | $59,360 |
| 2020 | $2,277 | $65,440 | $12,000 | $53,440 |
| 2019 | $2,149 | $62,480 | $10,000 | $52,480 |
| 2018 | $2,146 | $62,480 | $10,000 | $52,480 |
| 2016 | $1,421 | $36,600 | $6,000 | $30,600 |
| 2015 | $1,431 | $36,600 | $6,000 | $30,600 |
| 2014 | $1,436 | $36,600 | $6,000 | $30,600 |
Source: Public Records
Map
Nearby Homes
- 1649 Hay Patch Ln
- 1539 Hay Patch Ln
- 3590 Stephens Creek Place Unit 1
- 1670 Rose Garden Ln
- 1680 Rose Garden Ln
- 1795 Red Rose Ln
- 1601 Savory Way
- 1621 Savory Way
- 3564 Arrow Root Cir
- 1783 Juniper Berry Way
- 3614 Arrow Root Cir
- 1692 Juniper Berry Way
- 1350 Summer Lake Terrace
- 3800 Glen Ian Dr
- 1762 Juniper Berry Way
- 2232 Red Rose Ln
- 2212 Red Rose Ln
- 2202 Red Rose Ln Unit 1
- 2242 Red Rose Ln
- 2225 Red Rose Ln Unit 1
- 2295 Red Rose Ln Unit 1
- 2252 Red Rose Ln
- 2215 Red Rose Ln
- 2472 Range Heights Terrace
- 2305 Red Rose Ln Unit 2305
- 2305 Red Rose Ln
- 2192 Red Rose Ln
- 1866 Summit Creek Way
- 2462 Range Heights Terrace
- 1876 Summit Creek Way Unit Ga1329
- 1876 Summit Creek Way
- 1876 Summit Creek Way
- 1876 Summit Creek Way Unit GA13294
- 1856 Summit Creek Way Unit 2
- 2315 Red Rose Ln