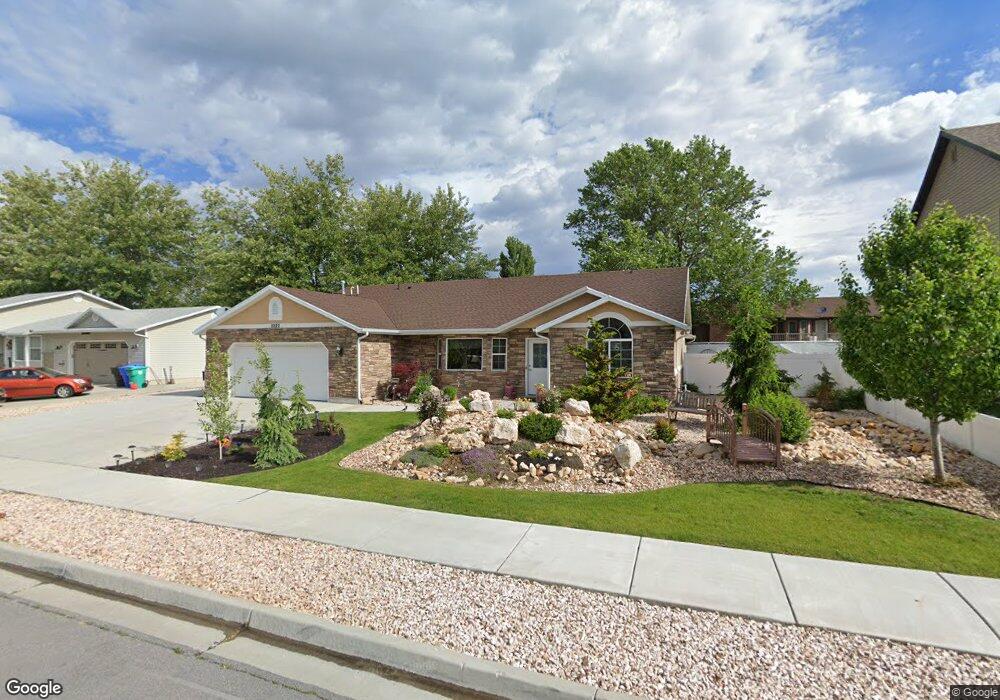
2222 W 470 N Unit 1 West Point, UT 84015
Estimated Value: $531,251 - $640,000
3
Beds
3
Baths
1,949
Sq Ft
$294/Sq Ft
Est. Value
About This Home
This home is located at 2222 W 470 N Unit 1, West Point, UT 84015 and is currently estimated at $573,063, approximately $294 per square foot. 2222 W 470 N Unit 1 is a home located in Davis County with nearby schools including Lakeside School, West Point Junior High School, and Syracuse High School.
Ownership History
Date
Name
Owned For
Owner Type
Purchase Details
Closed on
Sep 24, 2018
Sold by
Martinez Susan J
Bought by
Martinez Susan J and Susan J Martinez Living Trust
Current Estimated Value
Purchase Details
Closed on
May 14, 2013
Sold by
Martinez Joe V and Martinez Susan J
Bought by
Martinez Joe and Martinez Susan J
Home Financials for this Owner
Home Financials are based on the most recent Mortgage that was taken out on this home.
Original Mortgage
$177,500
Outstanding Balance
$123,189
Interest Rate
2.87%
Mortgage Type
Construction
Estimated Equity
$449,874
Purchase Details
Closed on
Mar 11, 2013
Sold by
Castle Creek Homes Llc
Bought by
Martinez Joe and Maritnez Susan J
Purchase Details
Closed on
Dec 20, 2012
Sold by
Nd Development Llc
Bought by
Castle Creek Homes Llc
Create a Home Valuation Report for This Property
The Home Valuation Report is an in-depth analysis detailing your home's value as well as a comparison with similar homes in the area
Home Values in the Area
Average Home Value in this Area
Purchase History
| Date | Buyer | Sale Price | Title Company |
|---|---|---|---|
| Martinez Susan J | -- | None Available | |
| Martinez Joe | -- | Inwest Title Services Inc | |
| Martinez Joe | -- | Mountain View Title | |
| Castle Creek Homes Llc | -- | Backman Title Services Ltd |
Source: Public Records
Mortgage History
| Date | Status | Borrower | Loan Amount |
|---|---|---|---|
| Open | Martinez Joe | $177,500 |
Source: Public Records
Tax History Compared to Growth
Tax History
| Year | Tax Paid | Tax Assessment Tax Assessment Total Assessment is a certain percentage of the fair market value that is determined by local assessors to be the total taxable value of land and additions on the property. | Land | Improvement |
|---|---|---|---|---|
| 2025 | $2,911 | $272,800 | $106,735 | $166,065 |
| 2024 | $2,799 | $263,451 | $96,124 | $167,327 |
| 2023 | $2,599 | $450,000 | $117,965 | $332,035 |
| 2022 | $2,896 | $274,450 | $60,851 | $213,599 |
| 2021 | $2,624 | $372,000 | $97,067 | $274,933 |
| 2020 | $2,301 | $322,000 | $81,179 | $240,821 |
| 2019 | $2,196 | $303,000 | $78,868 | $224,132 |
| 2018 | $2,074 | $282,000 | $79,677 | $202,323 |
| 2016 | $1,996 | $142,835 | $30,793 | $112,042 |
| 2015 | $1,856 | $125,840 | $30,793 | $95,047 |
| 2014 | $1,802 | $123,917 | $30,793 | $93,124 |
| 2013 | -- | $58,964 | $58,964 | $0 |
Source: Public Records
Map
Nearby Homes