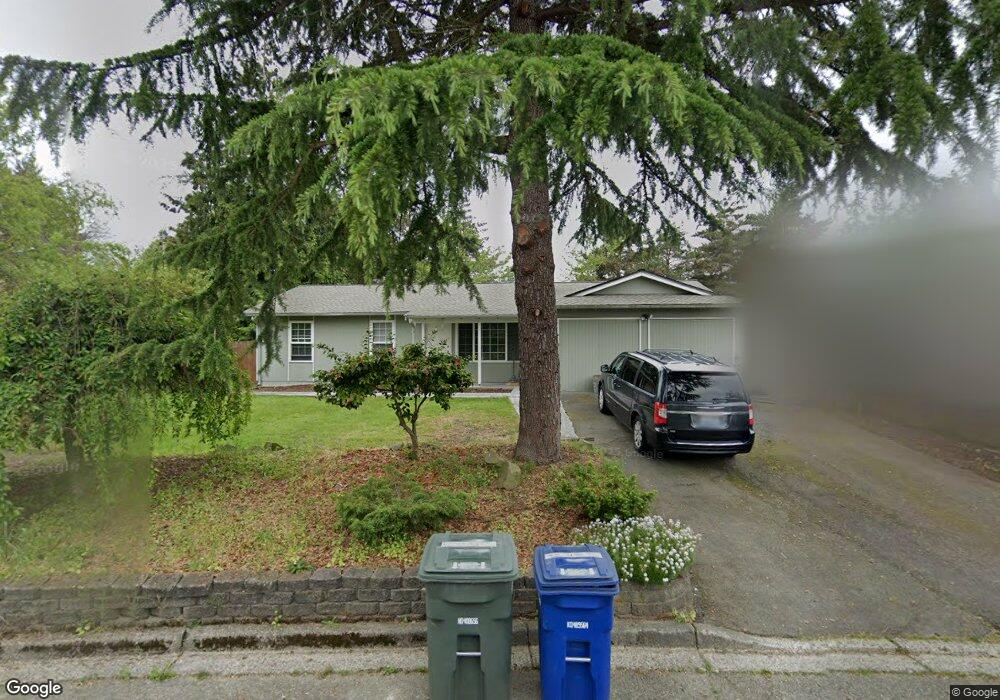
22228 2nd Ave W Bothell, WA 98021
Queensborough-Brentwood NeighborhoodEstimated Value: $724,000 - $838,000
4
Beds
2
Baths
1,200
Sq Ft
$661/Sq Ft
Est. Value
About This Home
This home is located at 22228 2nd Ave W, Bothell, WA 98021 and is currently estimated at $792,993, approximately $660 per square foot. 22228 2nd Ave W is a home located in Snohomish County with nearby schools including Frank Love Elementary School, Kenmore Middle School, and Bothell High School.
Ownership History
Date
Name
Owned For
Owner Type
Purchase Details
Closed on
Oct 16, 2020
Sold by
Hummel Steve
Bought by
Hummel Steven J and The Steve Hummel Revocable Liv
Current Estimated Value
Purchase Details
Closed on
Mar 16, 2009
Sold by
Forster Richard
Bought by
Hummel Steve
Home Financials for this Owner
Home Financials are based on the most recent Mortgage that was taken out on this home.
Original Mortgage
$134,550
Outstanding Balance
$83,603
Interest Rate
5.19%
Mortgage Type
Purchase Money Mortgage
Estimated Equity
$709,390
Purchase Details
Closed on
Nov 29, 2007
Sold by
Forster Patricia Louise
Bought by
Forster Richard F
Purchase Details
Closed on
Aug 11, 1998
Sold by
Hendrickson Mark E and Chilson Susan I
Bought by
Gutierrez Liliana
Home Financials for this Owner
Home Financials are based on the most recent Mortgage that was taken out on this home.
Original Mortgage
$153,000
Interest Rate
6.95%
Create a Home Valuation Report for This Property
The Home Valuation Report is an in-depth analysis detailing your home's value as well as a comparison with similar homes in the area
Home Values in the Area
Average Home Value in this Area
Purchase History
| Date | Buyer | Sale Price | Title Company |
|---|---|---|---|
| Hummel Steven J | -- | None Available | |
| Hummel Steve | $299,000 | Fidelity National Title | |
| Forster Richard F | -- | Chicago Title Insurance Co | |
| Forster Richard F | $199,000 | Chicago Title Insurance Co | |
| Gutierrez Liliana | $170,000 | -- |
Source: Public Records
Mortgage History
| Date | Status | Borrower | Loan Amount |
|---|---|---|---|
| Open | Hummel Steve | $134,550 | |
| Previous Owner | Gutierrez Liliana | $153,000 |
Source: Public Records
Tax History
| Year | Tax Paid | Tax Assessment Tax Assessment Total Assessment is a certain percentage of the fair market value that is determined by local assessors to be the total taxable value of land and additions on the property. | Land | Improvement |
|---|---|---|---|---|
| 2026 | $5,637 | $727,800 | $558,000 | $169,800 |
| 2025 | $5,222 | $660,400 | $495,000 | $165,400 |
| 2024 | $5,222 | $609,100 | $445,000 | $164,100 |
| 2023 | $6,405 | $823,700 | $600,000 | $223,700 |
| 2022 | $5,877 | $609,800 | $420,000 | $189,800 |
| 2020 | $5,046 | $484,300 | $287,000 | $197,300 |
| 2019 | $4,516 | $448,400 | $255,000 | $193,400 |
| 2018 | $4,113 | $392,800 | $220,000 | $172,800 |
| 2017 | $3,500 | $336,800 | $175,000 | $161,800 |
| 2016 | $3,132 | $310,600 | $155,000 | $155,600 |
| 2015 | $3,034 | $285,200 | $140,000 | $145,200 |
| 2013 | $2,711 | $223,800 | $113,000 | $110,800 |
Source: Public Records
Map
Nearby Homes
- 224 224th St SW
- 22426 3rd Place W
- 22619 4th Ave W Unit 3-103
- 104 219th Place SE
- 601 220th St SW
- 21713 Meridian Ave S
- 404 228th St SW Unit E101
- 22827 Meridian Ave S
- 100 228th St SE Unit 19B
- 600 228th St SW Unit I101
- 21707 2nd Ave SE
- 624 217th St SW
- 714 228th St SW Unit O101
- 410 214th St SW Unit B
- 29 232nd Place SW
- 18 232nd Place SW
- 19924 7th Dr SE
- 20021 7th Dr SE
- 20027 7th Dr SE
- 33 213th Place SW
- 22302 2nd Ave W
- 22220 2nd Ave W
- 22231 1st Place W
- 22210 2nd Ave W
- 22308 2nd Ave W
- 22223 2nd Ave W
- 22312 2nd Ave W
- 103 223rd St SW
- 104 222nd St SW
- 114 223rd St SW
- 115 222nd St SW
- 107 222nd St SW
- 106 223rd St SW
- 129 224th St SW
- 31 223rd St SW
- 32 222nd St SW
- 121 224th St SW
- 124 221st St SW
- 120 221st St SW
- 132 221st St SW
Your Personal Tour Guide
Ask me questions while you tour the home.