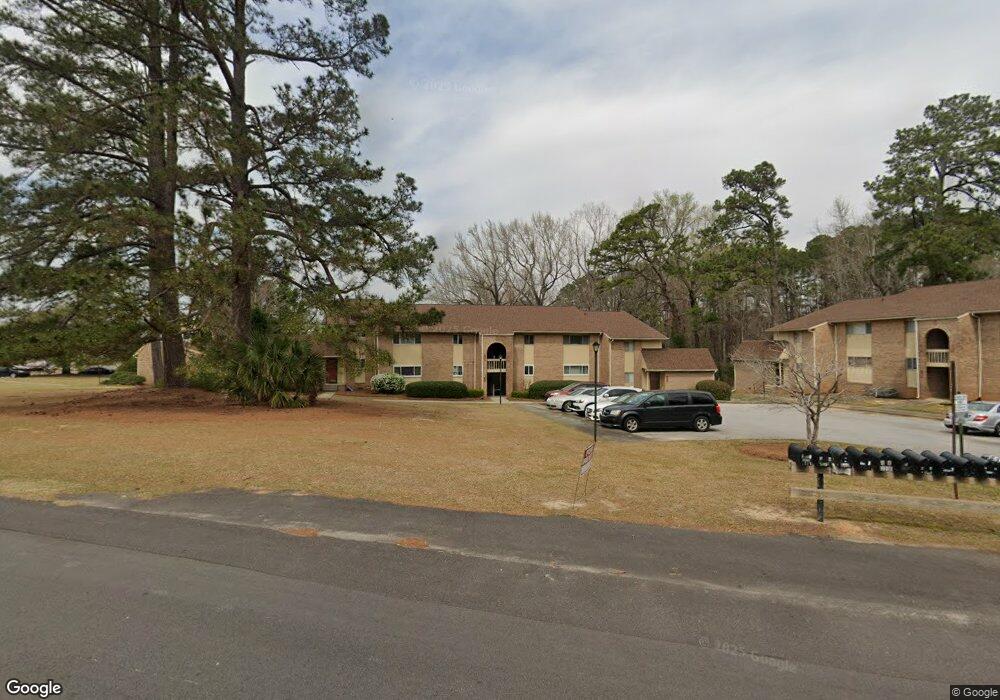
2223 Hillcrest Ave Unit D5 Orangeburg, SC 29118
Estimated Value: $84,000 - $93,000
2
Beds
2
Baths
988
Sq Ft
$90/Sq Ft
Est. Value
About This Home
This home is located at 2223 Hillcrest Ave Unit D5, Orangeburg, SC 29118 and is currently estimated at $89,090, approximately $90 per square foot. 2223 Hillcrest Ave Unit D5 is a home located in Orangeburg County with nearby schools including Marshall Elementary School, Marshall Elementary, and William J. Clark Middle School.
Ownership History
Date
Name
Owned For
Owner Type
Purchase Details
Closed on
Nov 2, 2023
Sold by
Funderburk Barbara A
Bought by
Axson Alicia
Current Estimated Value
Home Financials for this Owner
Home Financials are based on the most recent Mortgage that was taken out on this home.
Original Mortgage
$85,000
Outstanding Balance
$83,427
Interest Rate
7.19%
Mortgage Type
Seller Take Back
Estimated Equity
$5,663
Purchase Details
Closed on
Aug 24, 2018
Sold by
Funderburk Barbara A
Bought by
Funderburk Marion P and Funderburk Thomas Gregg
Purchase Details
Closed on
Jul 24, 2018
Sold by
Estate Of Marion P Funderburk
Bought by
Funderburk Barbara A
Purchase Details
Closed on
Apr 17, 2001
Sold by
Fogle L Merritt
Bought by
Funderburk Marion P and Funderburk Barbara A
Purchase Details
Closed on
Nov 14, 2000
Sold by
Laroche Vicki K and Elizabeth Klapman M
Bought by
Fogle L Merritt
Create a Home Valuation Report for This Property
The Home Valuation Report is an in-depth analysis detailing your home's value as well as a comparison with similar homes in the area
Home Values in the Area
Average Home Value in this Area
Purchase History
| Date | Buyer | Sale Price | Title Company |
|---|---|---|---|
| Axson Alicia | $85,000 | None Listed On Document | |
| Funderburk Marion P | -- | None Available | |
| Funderburk Barbara A | -- | None Available | |
| Funderburk Marion P | $52,500 | -- | |
| Fogle L Merritt | $52,000 | -- |
Source: Public Records
Mortgage History
| Date | Status | Borrower | Loan Amount |
|---|---|---|---|
| Open | Axson Alicia | $85,000 |
Source: Public Records
Tax History Compared to Growth
Tax History
| Year | Tax Paid | Tax Assessment Tax Assessment Total Assessment is a certain percentage of the fair market value that is determined by local assessors to be the total taxable value of land and additions on the property. | Land | Improvement |
|---|---|---|---|---|
| 2024 | $1,518 | $3,024 | $0 | $3,024 |
| 2023 | $6 | $3,024 | $0 | $3,024 |
| 2022 | $5 | $3,024 | $0 | $3,024 |
| 2021 | $5 | $3,024 | $0 | $3,024 |
| 2020 | $5 | $3,024 | $0 | $0 |
| 2019 | $5 | $3,024 | $0 | $0 |
| 2018 | $107 | $3,624 | $0 | $0 |
| 2017 | $102 | $3,624 | $0 | $0 |
| 2016 | $102 | $3,624 | $0 | $0 |
| 2015 | $59 | $3,624 | $0 | $0 |
| 2014 | $59 | $3,624 | $0 | $3,624 |
| 2013 | $45 | $2,456 | $0 | $2,456 |
Source: Public Records
Map
Nearby Homes
- 2251 Hillcrest Ave Unit 6C
- 2336 Northview Dr Unit 3-C
- 2348 Northview Dr Unit 3F
- 2354 Northview Dr Unit 2A
- 2358 Northview Dr Unit 2B
- 2320 Mall Terrace Ct Unit 2320
- 2160 Chestnut St
- 2249 Chestnut St
- 2415 Riley St
- 2069 Hydrick Ave
- 0 Old Riley St
- 2395 Lakeside St
- 0 S Circle Dr NW
- 2136 Pinnacle St
- 3058 Broughton St
- 336 Young Town Cir
- 312 Young Town Cir
- 272 Young Town Cir
- 284 Young Town Cir
- 2753 Hillcrest Ave
- 2219 Hillcrest Ave Unit E5
- 2227 Hillcrest Ave Unit 5
- 2215 Hillcrest Ave Unit F5
- 2231 Hillcrest Ave Unit 5B
- 2235 Hillcrest Ave Unit 5A
- 2239 Hillcrest Ave Unit 6F
- 2243 Hillcrest Ave Unit 6E
- 2304 Northview Dr Unit 4A
- 2308 Northview Dr Unit 4B
- 2247 Hillcrest Ave Unit 6D
- 2312 Northview Dr Unit 4C
- 2255 Hillcrest Ave Unit 6B
- 2316 Northview Dr Unit 4D
- 2259 Hillcrest Ave Unit A6
- 2259 Hillcrest 6-A
- 2320 Northview Dr
- 2324 Northview Dr Unit 4F
- 2269 Cluster Ct
- 2332 Northview Dr Unit 3B
- 2332 Northview Dr