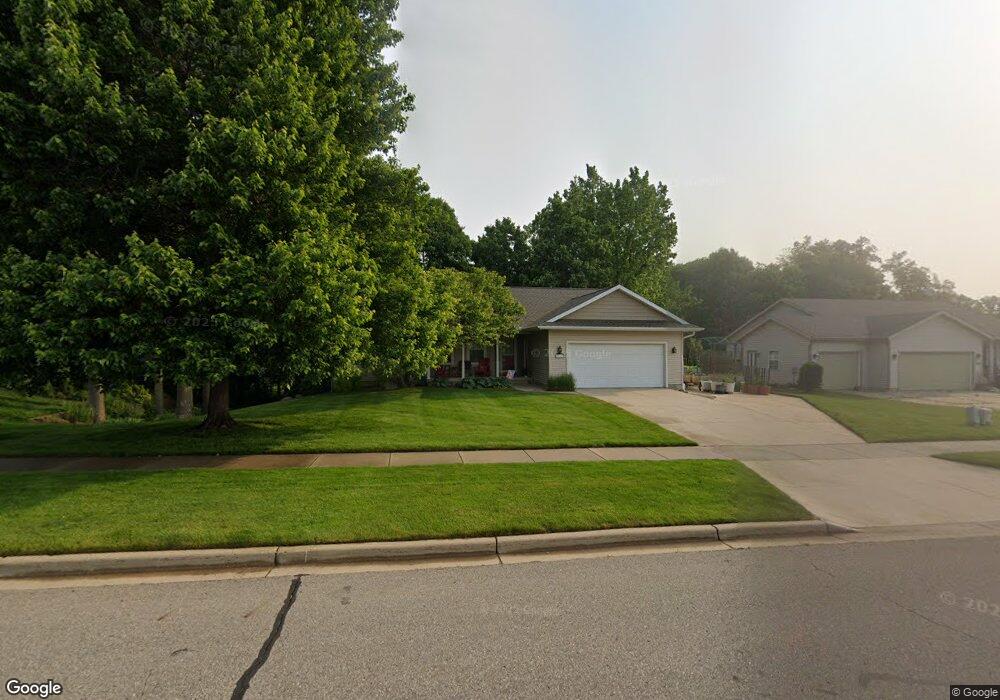
2223 Orchard Ridge Dr NW Grand Rapids, MI 49534
Estimated Value: $384,624 - $445,000
3
Beds
3
Baths
1,500
Sq Ft
$279/Sq Ft
Est. Value
About This Home
This home is located at 2223 Orchard Ridge Dr NW, Grand Rapids, MI 49534 and is currently estimated at $418,906, approximately $279 per square foot. 2223 Orchard Ridge Dr NW is a home located in Kent County with nearby schools including Kenowa Hills Central Elementary School, Kenowa Hills Middle School, and Kenowa Hills High School.
Ownership History
Date
Name
Owned For
Owner Type
Purchase Details
Closed on
Mar 26, 2024
Sold by
Walcott Marcie
Bought by
Walcott Marcie and Marcie Walcott Revocable Living Trust
Current Estimated Value
Purchase Details
Closed on
Mar 7, 2019
Sold by
Walcott Marcie
Bought by
Livin Walcott Marcie and Livin Marcie Walcott Revocable
Purchase Details
Closed on
Nov 15, 2017
Sold by
Walcott Timothy J
Bought by
Walcott Marcie
Home Financials for this Owner
Home Financials are based on the most recent Mortgage that was taken out on this home.
Original Mortgage
$52,000
Interest Rate
3.85%
Mortgage Type
New Conventional
Purchase Details
Closed on
Mar 6, 2003
Sold by
Unrath James and Unrath Dorothy
Bought by
Walcott Timothy J and Walcott Marcie L
Home Financials for this Owner
Home Financials are based on the most recent Mortgage that was taken out on this home.
Original Mortgage
$133,900
Interest Rate
6%
Create a Home Valuation Report for This Property
The Home Valuation Report is an in-depth analysis detailing your home's value as well as a comparison with similar homes in the area
Home Values in the Area
Average Home Value in this Area
Purchase History
| Date | Buyer | Sale Price | Title Company |
|---|---|---|---|
| Walcott Marcie | -- | None Listed On Document | |
| Livin Walcott Marcie | -- | None Available | |
| Walcott Marcie | -- | None Available | |
| Walcott Timothy J | $183,900 | -- |
Source: Public Records
Mortgage History
| Date | Status | Borrower | Loan Amount |
|---|---|---|---|
| Previous Owner | Walcott Marcie | $52,000 | |
| Previous Owner | Walcott Timothy J | $133,900 |
Source: Public Records
Tax History Compared to Growth
Tax History
| Year | Tax Paid | Tax Assessment Tax Assessment Total Assessment is a certain percentage of the fair market value that is determined by local assessors to be the total taxable value of land and additions on the property. | Land | Improvement |
|---|---|---|---|---|
| 2025 | $2,813 | $188,400 | $0 | $0 |
| 2024 | $2,813 | $167,000 | $0 | $0 |
| 2023 | $2,690 | $149,800 | $0 | $0 |
| 2022 | $2,885 | $138,600 | $0 | $0 |
| 2021 | $2,497 | $134,900 | $0 | $0 |
| 2020 | $2,475 | $128,600 | $0 | $0 |
| 2019 | $2,676 | $116,300 | $0 | $0 |
| 2018 | $2,676 | $109,000 | $0 | $0 |
| 2017 | $2,602 | $101,700 | $0 | $0 |
| 2016 | $2,500 | $91,400 | $0 | $0 |
| 2015 | $2,291 | $91,400 | $0 | $0 |
| 2013 | -- | $85,500 | $0 | $0 |
Source: Public Records
Map
Nearby Homes
- 4417 Remembrance Rd NW
- 13355 Kenowa Ave NW
- 4669 Gordonshire NW
- 1839 Stratford Ln NW
- 1821 Stratford Ln NW
- 2486 Falcon Pointe Dr NW
- 1845 Kenowa Ave NW
- 1866 Stratford Ln NW
- 1844 Stratford Ln NW
- 1767 Blaketon Dr NW
- 1734 Blaketon Dr
- 1728 Blaketon Dr
- 1869 Wilson Ave NW
- 2296 Wilson Ave NW
- 1537 Browning Dr
- 2549 Meadow Ridge Dr Unit 51
- 13953 Ironwood Dr NW
- V/L 8th Ave
- 3560 Richmond St NW
- 885 Meyer Ln
- 2241 Orchard Ridge Dr NW
- 2226 Orchard Ridge Dr NW
- 2214 Orchard Ridge Dr NW
- 2209 Orchard Ridge Dr NW
- 2202 Orchard Ridge Dr NW
- 2265 Orchard Ridge Dr NW
- 2203 Orchard Ridge Dr NW
- 2238 Orchard Ridge Dr NW
- 2250 Orchard Ridge Dr NW
- 2197 Orchard Ridge Dr NW
- 2190 Orchard Ridge Dr NW
- 2141 Applegate Dr NW
- 2277 Orchard Ridge Dr NW
- 2262 Orchard Ridge Dr NW
- 2147 Applegate Dr NW
- 2137 Applegate Dr NW
- 2191 Orchard Ridge Dr NW
- 2274 Orchard Ridge Dr NW
- 2151 Applegate Dr NW
- 2178 Orchard Ridge Dr NW