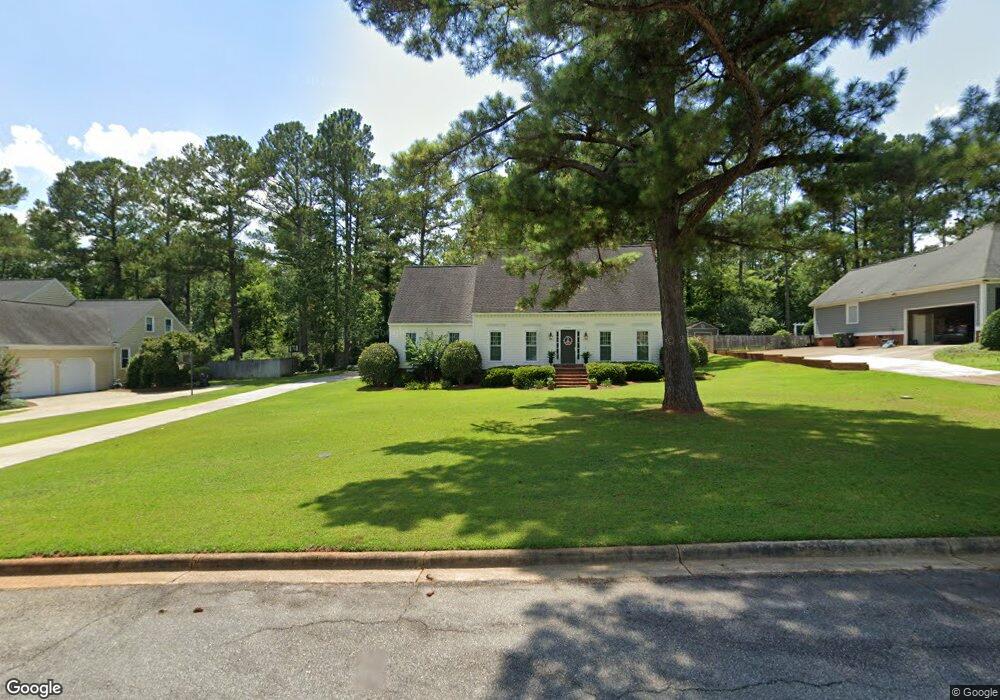
2223 Pendleton St Albany, GA 31721
Estimated Value: $327,690 - $378,000
4
Beds
3
Baths
2,616
Sq Ft
$133/Sq Ft
Est. Value
About This Home
This home is located at 2223 Pendleton St, Albany, GA 31721 and is currently estimated at $347,673, approximately $132 per square foot. 2223 Pendleton St is a home located in Dougherty County with nearby schools including Live Oak Elementary School, Merry Acres Middle School, and Westover High School.
Ownership History
Date
Name
Owned For
Owner Type
Purchase Details
Closed on
Aug 17, 2007
Sold by
Bridges Louis Calvin
Bought by
Woodham Jack Stephen and Woodham Jennifer Marie
Current Estimated Value
Home Financials for this Owner
Home Financials are based on the most recent Mortgage that was taken out on this home.
Original Mortgage
$165,000
Outstanding Balance
$101,178
Interest Rate
6.5%
Mortgage Type
New Conventional
Estimated Equity
$246,495
Purchase Details
Closed on
Jul 5, 2005
Sold by
Moye Geronda Kay
Bought by
Bridges Louis Calvin
Purchase Details
Closed on
Mar 23, 1998
Sold by
Hearon H Lawson
Bought by
Moye Geronda Kay
Purchase Details
Closed on
Apr 22, 1994
Sold by
Hearon Construction Co
Bought by
Hearon H Lawson
Purchase Details
Closed on
Mar 23, 1994
Sold by
Walden & Kirkland Inc
Bought by
Hearon Construction Co
Create a Home Valuation Report for This Property
The Home Valuation Report is an in-depth analysis detailing your home's value as well as a comparison with similar homes in the area
Purchase History
| Date | Buyer | Sale Price | Title Company |
|---|---|---|---|
| Woodham Jack Stephen | $265,000 | -- | |
| Bridges Louis Calvin | $225,000 | -- | |
| Moye Geronda Kay | $208,500 | -- | |
| Hearon H Lawson | $134,000 | -- | |
| Hearon Construction Co | $13,000 | -- |
Source: Public Records
Mortgage History
| Date | Status | Borrower | Loan Amount |
|---|---|---|---|
| Open | Woodham Jack Stephen | $165,000 | |
| Closed | Bridges Louis Calvin | $0 |
Source: Public Records
Tax History
| Year | Tax Paid | Tax Assessment Tax Assessment Total Assessment is a certain percentage of the fair market value that is determined by local assessors to be the total taxable value of land and additions on the property. | Land | Improvement |
|---|---|---|---|---|
| 2025 | $4,130 | $86,000 | $12,000 | $74,000 |
| 2024 | $4,130 | $86,336 | $12,000 | $74,336 |
| 2023 | $3,067 | $86,336 | $12,000 | $74,336 |
| 2022 | $3,908 | $86,336 | $12,000 | $74,336 |
| 2021 | $3,618 | $86,336 | $12,000 | $74,336 |
| 2020 | $3,623 | $86,336 | $12,000 | $74,336 |
| 2019 | $3,632 | $86,336 | $12,000 | $74,336 |
| 2018 | $3,641 | $86,336 | $12,000 | $74,336 |
| 2017 | $3,388 | $86,336 | $12,000 | $74,336 |
| 2016 | $3,391 | $86,336 | $12,000 | $74,336 |
| 2015 | -- | $86,336 | $12,000 | $74,336 |
| 2014 | $3,355 | $86,496 | $12,160 | $74,336 |
Source: Public Records
Map
Nearby Homes
- 2220 Wallington Dr
- 2200 Wycliff Ln
- 4426 Woodcrest Dr
- 4424 Woodcrest Dr
- 2308 E Doublegate Dr
- 4815 Marlborough Ave
- 4404 Woodcrest Dr
- 619 Springfield Dr
- 4805 Millbrooke Rd
- 2514 E Doublegate Dr
- 3820 Dominion Ct
- 4506 Chateau Dr
- 4302 Old Dawson Rd
- 2621 Crofton Dr
- 3812 Old Dawson Rd
- 2600 E Doublegate Dr
- 2700 Mccall Ct
- 3705 Old Dawson Rd
- 120 Byron Plantation Rd
- 3628 Quail Hollow Rd
- 2225 Pendleton St
- 2221 Pendleton St
- 2301 Pendleton St
- 2219 Pendleton St
- 2226 Pendleton St
- 2224 Pendleton St
- 2222 Pendleton St
- 2303 Pendleton St
- 2217 Pendleton St
- 2300 Pendleton St
- 2220 Pendleton St
- 2228 Wallington Dr
- 2302 Pendleton St
- 2226 Wallington Dr
- 2305 Pendleton St
- 2215 Pendleton St
- 2218 Pendleton St
- 2300 Wallington Dr
- 2224 Wallington Dr
- 2504 Cooleewahee Cove Ct
Your Personal Tour Guide
Ask me questions while you tour the home.