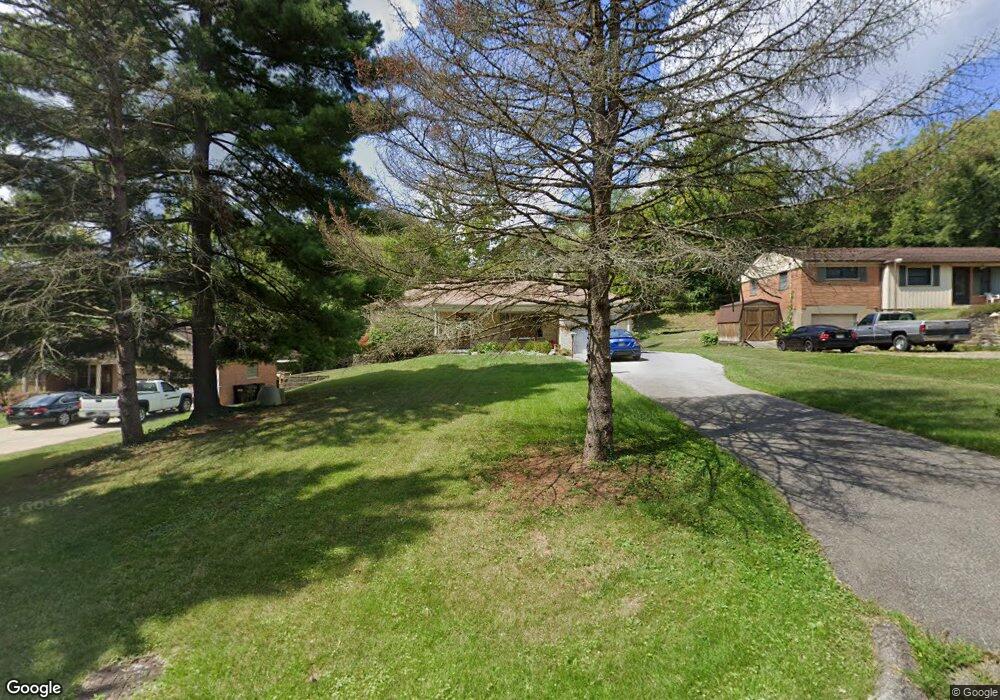
2223 Ripplebrook Dr Cincinnati, OH 45231
New Burlington NeighborhoodEstimated Value: $191,000 - $224,000
3
Beds
2
Baths
1,155
Sq Ft
$181/Sq Ft
Est. Value
About This Home
This home is located at 2223 Ripplebrook Dr, Cincinnati, OH 45231 and is currently estimated at $208,700, approximately $180 per square foot. 2223 Ripplebrook Dr is a home located in Hamilton County with nearby schools including Mt Healthy High School and Central Montessori Academy.
Ownership History
Date
Name
Owned For
Owner Type
Purchase Details
Closed on
Jun 6, 2019
Sold by
Siefert Stephen
Bought by
Siefert Stephen and Cline Michelle
Current Estimated Value
Purchase Details
Closed on
Mar 28, 2016
Sold by
Siefert Brian B
Bought by
Siefert Stephen
Home Financials for this Owner
Home Financials are based on the most recent Mortgage that was taken out on this home.
Interest Rate
3.71%
Purchase Details
Closed on
Nov 30, 2012
Sold by
Siefert Steve F and Siefert Brian B
Bought by
Siefert Brian B and Siefert Angela M
Purchase Details
Closed on
Dec 21, 2004
Sold by
Siefert Joseph J and Siefert Melissa
Bought by
Seifert Steve F and Seifert Brian B
Home Financials for this Owner
Home Financials are based on the most recent Mortgage that was taken out on this home.
Original Mortgage
$99,216
Interest Rate
5.9%
Mortgage Type
FHA
Purchase Details
Closed on
Jun 27, 1996
Sold by
Cottingham Loretta A
Bought by
Siefert Joseph J
Home Financials for this Owner
Home Financials are based on the most recent Mortgage that was taken out on this home.
Original Mortgage
$75,350
Interest Rate
8.07%
Mortgage Type
VA
Create a Home Valuation Report for This Property
The Home Valuation Report is an in-depth analysis detailing your home's value as well as a comparison with similar homes in the area
Home Values in the Area
Average Home Value in this Area
Purchase History
| Date | Buyer | Sale Price | Title Company |
|---|---|---|---|
| Siefert Stephen | -- | None Available | |
| Siefert Stephen | $76,000 | -- | |
| Siefert Brian B | $43,000 | Attorney | |
| Seifert Steve F | -- | -- | |
| Siefert Joseph J | $73,900 | -- |
Source: Public Records
Mortgage History
| Date | Status | Borrower | Loan Amount |
|---|---|---|---|
| Closed | Siefert Stephen | -- | |
| Previous Owner | Seifert Steve F | $99,216 | |
| Previous Owner | Siefert Joseph J | $75,350 |
Source: Public Records
Tax History
| Year | Tax Paid | Tax Assessment Tax Assessment Total Assessment is a certain percentage of the fair market value that is determined by local assessors to be the total taxable value of land and additions on the property. | Land | Improvement |
|---|---|---|---|---|
| 2025 | $3,050 | $52,374 | $10,213 | $42,161 |
| 2023 | $2,871 | $52,374 | $10,213 | $42,161 |
| 2022 | $2,392 | $31,388 | $9,632 | $21,756 |
| 2021 | $2,328 | $31,388 | $9,632 | $21,756 |
| 2020 | $2,363 | $31,388 | $9,632 | $21,756 |
| 2019 | $2,142 | $26,600 | $8,162 | $18,438 |
| 2018 | $2,154 | $26,600 | $8,162 | $18,438 |
| 2017 | $2,044 | $26,600 | $8,162 | $18,438 |
| 2016 | $2,001 | $25,666 | $8,162 | $17,504 |
| 2015 | $2,016 | $25,666 | $8,162 | $17,504 |
| 2014 | $2,007 | $25,666 | $8,162 | $17,504 |
| 2013 | $2,309 | $30,195 | $9,604 | $20,591 |
Source: Public Records
Map
Nearby Homes
- 2175 Carlsbory Dr
- 2329 Garrison Dr
- 2317 Magdalena Dr
- 9391 Jericho Dr
- 9151 Tag Dr
- 9287 Coogan Dr
- 2547 Adams Rd
- 9500 Ridgemoor Ave
- 2528 Mariposa St
- 2005 Miles Rd
- 9224 Comstock Dr
- 9846 Pinedale Dr
- 624 Brightview Dr
- 626 Brightview Dr
- 606 Brightview Dr
- 610 Brightview Dr
- 622 Brightview Dr
- 614 Brightview Dr
- 616 Brightview Dr
- 620 Brightview Dr
- 2229 Ripplebrook Dr
- 2217 Ripplebrook Dr
- 0 Ripplebrook Dr
- 2235 Ripplebrook Dr
- 2211 Ripplebrook Dr
- 2241 Ripplebrook Dr
- 2279 Adams Rd
- 2285 Adams Rd
- 2199 Carlsbory Dr
- 9351 Ranchill Dr
- 2225 Adams Ridge Dr
- 2291 Adams Rd
- 2234 Adams Ridge Dr
- 9347 Ranchill Dr
- 9394 Montoro Dr
- 9386 Montoro Dr
- 2297 Adams Rd
- 2203 Adams Ridge Dr
- 2187 Carlsbory Dr
- 2220 Adams Ridge Dr
Your Personal Tour Guide
Ask me questions while you tour the home.