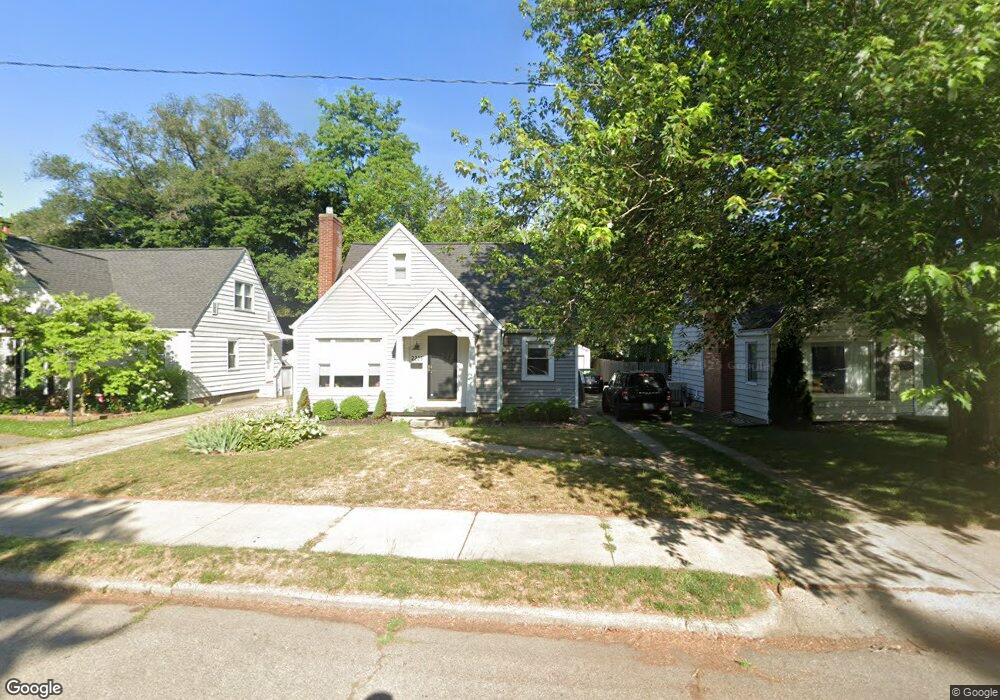
2223 Riverside Dr NE Grand Rapids, MI 49505
Creston NeighborhoodEstimated Value: $312,000 - $337,292
3
Beds
2
Baths
1,266
Sq Ft
$256/Sq Ft
Est. Value
About This Home
This home is located at 2223 Riverside Dr NE, Grand Rapids, MI 49505 and is currently estimated at $323,573, approximately $255 per square foot. 2223 Riverside Dr NE is a home located in Kent County with nearby schools including Riverside Middle School, Union High School, and ISJ Academy.
Ownership History
Date
Name
Owned For
Owner Type
Purchase Details
Closed on
Aug 5, 2024
Sold by
Vanderveen Leah M
Bought by
Sids Slumber Llc
Current Estimated Value
Purchase Details
Closed on
Oct 31, 2022
Sold by
Vanderveen Leah M
Bought by
Vanderveen Leah M
Purchase Details
Closed on
Oct 21, 2015
Sold by
Oseland David J and Wilson Betsy
Bought by
Vanderveen Leah M
Home Financials for this Owner
Home Financials are based on the most recent Mortgage that was taken out on this home.
Original Mortgage
$129,000
Interest Rate
3.91%
Mortgage Type
New Conventional
Purchase Details
Closed on
Jun 29, 2009
Sold by
Amshey Jeremy and Amshey Kelly
Bought by
Oseland David J
Home Financials for this Owner
Home Financials are based on the most recent Mortgage that was taken out on this home.
Original Mortgage
$75,000
Interest Rate
4.94%
Mortgage Type
Purchase Money Mortgage
Purchase Details
Closed on
May 23, 2007
Sold by
Taylor Carmen L and Taylor Moise T
Bought by
Taylor Carmen L and Carmen L Taylor Trust #1
Purchase Details
Closed on
Dec 30, 1996
Sold by
Gorman Gorman J J and Gorman Deroseau M
Bought by
Oseland Deroseau M and Oseland David J
Create a Home Valuation Report for This Property
The Home Valuation Report is an in-depth analysis detailing your home's value as well as a comparison with similar homes in the area
Home Values in the Area
Average Home Value in this Area
Purchase History
| Date | Buyer | Sale Price | Title Company |
|---|---|---|---|
| Sids Slumber Llc | $330,000 | Sun Title | |
| Vanderveen Leah M | -- | -- | |
| Vanderveen Leah M | $148,000 | First American Title Ins Co | |
| Oseland David J | $115,000 | Chicago Title | |
| Taylor Carmen L | -- | None Available | |
| Oseland Deroseau M | $67,900 | -- |
Source: Public Records
Mortgage History
| Date | Status | Borrower | Loan Amount |
|---|---|---|---|
| Previous Owner | Vanderveen Leah M | $129,000 | |
| Previous Owner | Oseland David J | $75,000 |
Source: Public Records
Tax History Compared to Growth
Tax History
| Year | Tax Paid | Tax Assessment Tax Assessment Total Assessment is a certain percentage of the fair market value that is determined by local assessors to be the total taxable value of land and additions on the property. | Land | Improvement |
|---|---|---|---|---|
| 2025 | $2,491 | $145,100 | $0 | $0 |
| 2024 | $2,491 | $134,200 | $0 | $0 |
| 2023 | $2,386 | $115,000 | $0 | $0 |
| 2022 | $2,399 | $92,900 | $0 | $0 |
| 2021 | $2,283 | $90,400 | $0 | $0 |
| 2020 | $2,183 | $82,300 | $0 | $0 |
| 2019 | $2,286 | $78,400 | $0 | $0 |
| 2018 | $2,208 | $71,200 | $0 | $0 |
| 2017 | $2,149 | $61,600 | $0 | $0 |
| 2016 | $2,175 | $58,000 | $0 | $0 |
| 2015 | $1,438 | $58,000 | $0 | $0 |
| 2013 | -- | $42,300 | $0 | $0 |
Source: Public Records
Map
Nearby Homes
- 68 Bowne St NE
- 122 Bowne St NE
- 16 Graceland St NE
- 240 Eleanor St NE
- 2060 Swensberg Ave NE
- 2107 Prospect Ave NE
- 22 Elmwood St NE
- 1922 Coit Ave NE
- 2480 Lafayette Ave NE
- 225 Burr Oak St NE
- 142 Burr Oak St NE
- 2624 Monroe Ave NE
- 143 Dean St NE
- 465 Kenwood St NE
- 483 Kenwood St NE
- 155 Palmer St NE
- 2630 Oakwood Ave NE
- 30 Palmer St NW
- 518 Russwood St NE
- 2033 Melita Ave NE
- 2227 Riverside Dr NE
- 2217 Riverside Dr NE
- 2213 Riverside Dr NE
- 2231 Riverside Dr NE
- 2224 Monroe Ave NW
- 2220 Monroe Ave NW
- 2230 Monroe Ave NW
- 2207 Riverside Dr NE
- 2216 Monroe Ave NW
- 2234 Monroe Ave NW
- 2218 Riverside Dr NE
- 2214 Riverside Dr NE
- 2222 Riverside Dr NE
- 2210 Monroe Ave NW
- 2210 Riverside Dr NE
- 2203 Riverside Dr NE
- 2206 Riverside Dr NE
- 2230 Riverside Dr NE
- 2206 Monroe Ave NW
- 2206 Monroe Ave NW