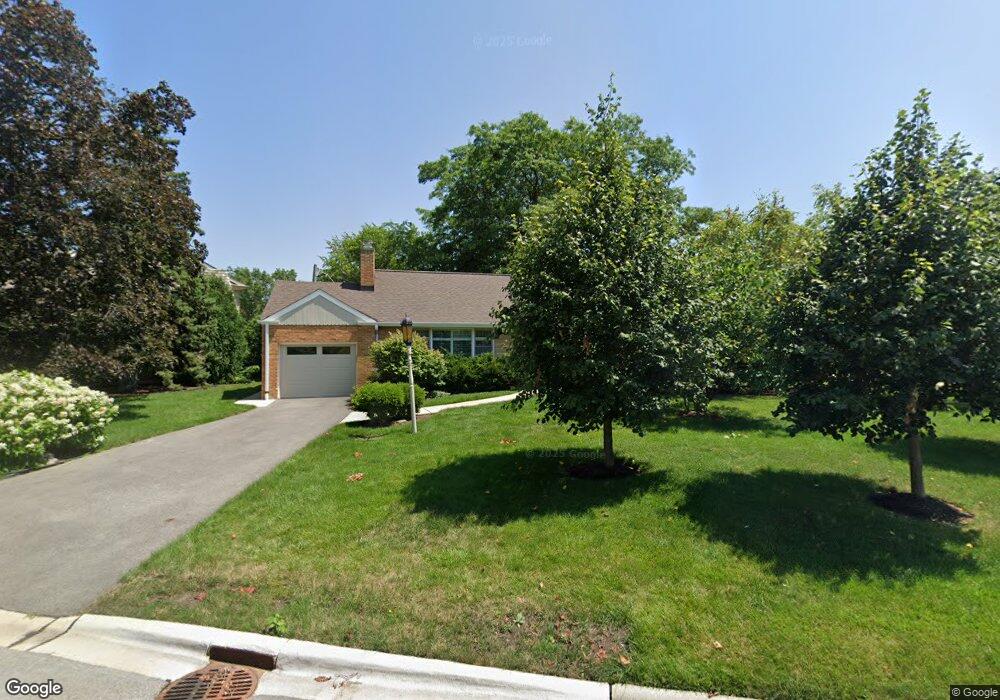
2223 Robincrest Ln Glenview, IL 60025
Estimated Value: $577,000 - $695,000
3
Beds
3
Baths
1,430
Sq Ft
$444/Sq Ft
Est. Value
About This Home
This home is located at 2223 Robincrest Ln, Glenview, IL 60025 and is currently estimated at $635,445, approximately $444 per square foot. 2223 Robincrest Ln is a home located in Cook County with nearby schools including Hoffman Elementary School, Henking Elementary School, and Springman Middle School.
Ownership History
Date
Name
Owned For
Owner Type
Purchase Details
Closed on
Nov 22, 2006
Sold by
Devon Bank
Bought by
Sielger Lynn R and The Lynn R Siegler Trust
Current Estimated Value
Purchase Details
Closed on
Mar 11, 2004
Sold by
Siegler Lynn and Simonsen Martin A
Bought by
Devon Bank and Trust #6919
Purchase Details
Closed on
Oct 27, 2003
Sold by
Garlich Marvin O and Garlich Carolyn A
Bought by
Simonsen Martin A and Siegler Lynn
Home Financials for this Owner
Home Financials are based on the most recent Mortgage that was taken out on this home.
Original Mortgage
$300,000
Interest Rate
6.02%
Mortgage Type
Unknown
Purchase Details
Closed on
Jul 25, 2000
Sold by
Garlich Marvin O and Garlich Carolyn A
Bought by
Garlich Marvin O and Garlich Carolyn A
Create a Home Valuation Report for This Property
The Home Valuation Report is an in-depth analysis detailing your home's value as well as a comparison with similar homes in the area
Home Values in the Area
Average Home Value in this Area
Purchase History
| Date | Buyer | Sale Price | Title Company |
|---|---|---|---|
| Sielger Lynn R | -- | None Available | |
| Devon Bank | -- | -- | |
| Simonsen Martin A | $397,500 | -- | |
| Garlich Marvin O | -- | -- |
Source: Public Records
Mortgage History
| Date | Status | Borrower | Loan Amount |
|---|---|---|---|
| Previous Owner | Simonsen Martin A | $300,000 |
Source: Public Records
Tax History
| Year | Tax Paid | Tax Assessment Tax Assessment Total Assessment is a certain percentage of the fair market value that is determined by local assessors to be the total taxable value of land and additions on the property. | Land | Improvement |
|---|---|---|---|---|
| 2025 | $9,487 | $55,000 | $18,770 | $36,230 |
| 2024 | $9,487 | $46,179 | $15,806 | $30,373 |
| 2023 | $9,895 | $46,179 | $15,806 | $30,373 |
| 2022 | $9,895 | $49,426 | $15,806 | $33,620 |
| 2021 | $7,757 | $34,495 | $12,101 | $22,394 |
| 2020 | $7,721 | $34,495 | $12,101 | $22,394 |
| 2019 | $7,721 | $40,446 | $12,101 | $28,345 |
| 2018 | $7,572 | $36,359 | $10,619 | $25,740 |
| 2017 | $7,384 | $36,359 | $10,619 | $25,740 |
| 2016 | $7,163 | $36,359 | $10,619 | $25,740 |
| 2015 | $6,395 | $29,479 | $8,644 | $20,835 |
| 2014 | $6,475 | $30,265 | $8,644 | $21,621 |
| 2013 | $6,614 | $31,810 | $8,644 | $23,166 |
Source: Public Records
Map
Nearby Homes
- 625 Wissing Ln
- 517 Briarhill Ln
- 2009 Robincrest Ln
- 440 Briarhill Rd
- 2537 Pick Dr
- 2238 Prairie St
- 1088 Shermer Rd Unit DW
- 1777 Dewes St Unit E
- 1800 Dewes St Unit 310
- 1853 Prairie St Unit A4
- 706 Waukegan Rd Unit 4
- 1730 George Ct
- 2700 Fontana Dr
- 245 Nora Ave
- 311 Neva Ave
- 216 Flora Ave
- 124 Harlem Ave
- 1220 Depot St Unit 305
- 609 Carriage Hill Dr
- 711 Carriage Hill Dr
- 624 Wissing Ln
- 2211 Robincrest Ln Unit 6
- 2225 Robincrest Ln
- 2220 Robincrest Ln
- 620 Wissing Ln
- 2229 Robincrest Ln
- 2230 Robincrest Ln
- 2233 Robincrest Ln
- 2210 Robincrest Ln
- 2228 Robincrest Ln
- 2222 Robincrest Ln
- 618 Wissing Ln
- 2239 Robincrest Ln
- 650 Spruce St
- 2224 Robincrest Ln Unit 6
- 2220 Central Rd
- 2201 Robincrest Ln
- 2240 Robincrest Ln
- 2226 Central Rd
- 2214 Central Rd
Your Personal Tour Guide
Ask me questions while you tour the home.