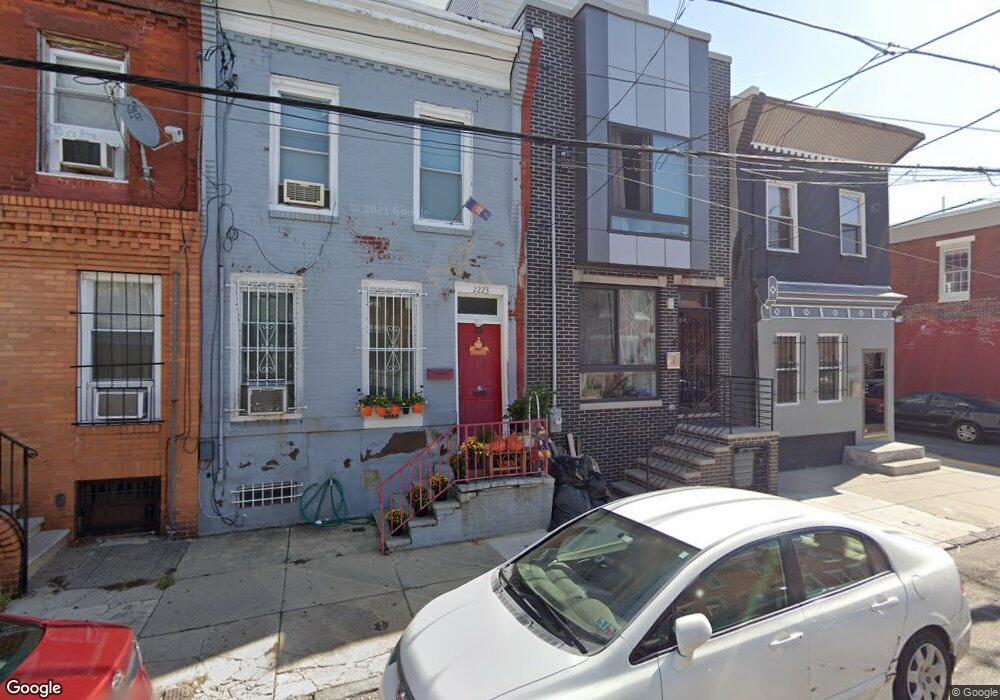
2223 S 5th St Philadelphia, PA 19148
Whitman NeighborhoodEstimated Value: $234,000 - $279,000
3
Beds
1
Bath
1,320
Sq Ft
$201/Sq Ft
Est. Value
About This Home
This home is located at 2223 S 5th St, Philadelphia, PA 19148 and is currently estimated at $265,619, approximately $201 per square foot. 2223 S 5th St is a home located in Philadelphia County with nearby schools including John H. Taggart School and Furness Horace High School.
Ownership History
Date
Name
Owned For
Owner Type
Purchase Details
Closed on
Oct 20, 2017
Sold by
T Capital Investmnet Sllc
Bought by
Taing Ly Thoung
Current Estimated Value
Purchase Details
Closed on
Aug 20, 2010
Sold by
Bac Home Loans Servicing Lp
Bought by
T Capital Investments Llc
Purchase Details
Closed on
Apr 5, 2010
Sold by
Triglia Raymond and Triglia Donna
Bought by
Bac Home Loans Servicing Lp and Countrywide Home Loans Servicing Lp
Purchase Details
Closed on
Apr 14, 2004
Sold by
Freedman Albert and Freedman Estelle
Bought by
Triglia Raymond and Triglia Donna
Home Financials for this Owner
Home Financials are based on the most recent Mortgage that was taken out on this home.
Original Mortgage
$54,810
Interest Rate
5.88%
Mortgage Type
Purchase Money Mortgage
Create a Home Valuation Report for This Property
The Home Valuation Report is an in-depth analysis detailing your home's value as well as a comparison with similar homes in the area
Home Values in the Area
Average Home Value in this Area
Purchase History
| Date | Buyer | Sale Price | Title Company |
|---|---|---|---|
| Taing Ly Thoung | $70,000 | None Available | |
| T Capital Investments Llc | $70,000 | North American Title Ins Co | |
| Bac Home Loans Servicing Lp | $3,100 | None Available | |
| Triglia Raymond | $60,000 | -- |
Source: Public Records
Mortgage History
| Date | Status | Borrower | Loan Amount |
|---|---|---|---|
| Previous Owner | Triglia Raymond | $54,810 |
Source: Public Records
Tax History Compared to Growth
Tax History
| Year | Tax Paid | Tax Assessment Tax Assessment Total Assessment is a certain percentage of the fair market value that is determined by local assessors to be the total taxable value of land and additions on the property. | Land | Improvement |
|---|---|---|---|---|
| 2026 | $3,025 | $253,300 | $50,660 | $202,640 |
| 2025 | $3,025 | $253,300 | $50,660 | $202,640 |
| 2024 | $3,025 | $253,300 | $50,660 | $202,640 |
| 2023 | $3,025 | $216,100 | $43,220 | $172,880 |
| 2022 | $1,699 | $171,100 | $43,220 | $127,880 |
| 2021 | $2,329 | $0 | $0 | $0 |
| 2020 | $2,329 | $0 | $0 | $0 |
| 2019 | $2,090 | $0 | $0 | $0 |
| 2018 | $0 | $0 | $0 | $0 |
| 2017 | $1,538 | $0 | $0 | $0 |
| 2016 | $12,810 | $0 | $0 | $0 |
| 2015 | $12,810 | $0 | $0 | $0 |
| 2014 | -- | $131,100 | $17,435 | $113,665 |
| 2012 | -- | $4,480 | $1,091 | $3,389 |
Source: Public Records
Map
Nearby Homes