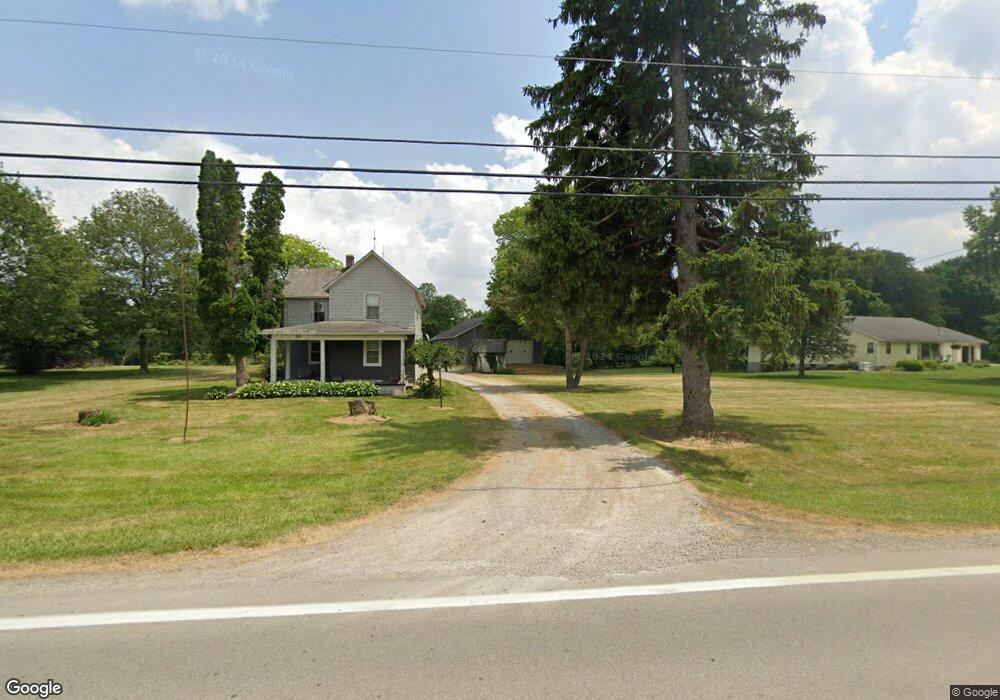
2223 S State Route 53 Tiffin, OH 44883
Estimated Value: $171,000 - $270,000
2
Beds
2
Baths
2,382
Sq Ft
$100/Sq Ft
Est. Value
About This Home
This home is located at 2223 S State Route 53, Tiffin, OH 44883 and is currently estimated at $237,559, approximately $99 per square foot. 2223 S State Route 53 is a home located in Seneca County with nearby schools including Hopewell-Loudon Local Elementary School, North Central Academy - Fremont, and Calvert Catholic Elementary School.
Ownership History
Date
Name
Owned For
Owner Type
Purchase Details
Closed on
Jan 31, 2020
Sold by
Bingham Ethan J and Bingham Haeli L
Bought by
Sauber Lane and Wheeler Jordon
Current Estimated Value
Home Financials for this Owner
Home Financials are based on the most recent Mortgage that was taken out on this home.
Original Mortgage
$142,373
Outstanding Balance
$126,979
Interest Rate
3.99%
Mortgage Type
FHA
Estimated Equity
$110,580
Purchase Details
Closed on
May 10, 2019
Sold by
Herman Kimberly Sue
Bought by
Bingham Ethan J and Bingham Haeli L
Home Financials for this Owner
Home Financials are based on the most recent Mortgage that was taken out on this home.
Original Mortgage
$132,890
Interest Rate
4%
Mortgage Type
New Conventional
Purchase Details
Closed on
Sep 3, 1998
Sold by
Kies Ronald N
Bought by
Herman Kimberly Sue Trustee
Purchase Details
Closed on
Apr 1, 1985
Create a Home Valuation Report for This Property
The Home Valuation Report is an in-depth analysis detailing your home's value as well as a comparison with similar homes in the area
Home Values in the Area
Average Home Value in this Area
Purchase History
| Date | Buyer | Sale Price | Title Company |
|---|---|---|---|
| Sauber Lane | $145,000 | Assured Title | |
| Bingham Ethan J | $137,000 | Assured Title | |
| Herman Kimberly Sue Trustee | -- | -- | |
| -- | $42,500 | -- |
Source: Public Records
Mortgage History
| Date | Status | Borrower | Loan Amount |
|---|---|---|---|
| Open | Sauber Lane | $142,373 | |
| Previous Owner | Bingham Ethan J | $132,890 |
Source: Public Records
Tax History Compared to Growth
Tax History
| Year | Tax Paid | Tax Assessment Tax Assessment Total Assessment is a certain percentage of the fair market value that is determined by local assessors to be the total taxable value of land and additions on the property. | Land | Improvement |
|---|---|---|---|---|
| 2024 | $2,084 | $55,990 | $7,500 | $48,490 |
| 2023 | $2,085 | $55,990 | $7,500 | $48,490 |
| 2022 | $1,877 | $46,440 | $4,910 | $41,530 |
| 2021 | $1,888 | $46,440 | $4,910 | $41,530 |
| 2020 | $1,897 | $46,435 | $4,907 | $41,528 |
| 2019 | $1,263 | $39,348 | $4,267 | $35,081 |
| 2018 | $1,362 | $40,968 | $5,887 | $35,081 |
| 2017 | $1,384 | $40,968 | $5,887 | $35,081 |
| 2016 | $1,215 | $39,659 | $5,887 | $33,772 |
| 2015 | $1,199 | $39,659 | $5,887 | $33,772 |
| 2014 | $1,136 | $39,659 | $5,887 | $33,772 |
| 2013 | $1,237 | $39,659 | $5,887 | $33,772 |
Source: Public Records
Map
Nearby Homes
- 2351 S State Route 53
- 1590 Meadowlake Dr
- 2050 W County Road 52
- 841 S Sandusky St
- 185 Longfellow Dr
- 153 Longfellow Dr
- 2465 S County Road 19
- 0 County Road 54 Unit 225023228
- 0 County Road 54 Unit 20242258
- 2483 W County Road 52
- 2031 W County Road 52
- 106 Sycamore Woods Ln
- 378 Lelar St
- 269 Lelar St
- 137 Hampden Park
- 125 W Woodmere Dr
- 115 Lindsay Ave
- 0 W Market St
- 43 Siesta Dr
- 38 N Tecumseh Trail
- 2255 S State Route 53
- 2167 S State Route 53
- 2284 S State Route 53
- 2153 S State Route 53
- 2309 S State Route 53
- 2300 S State Route 53
- 2298 S State Route 53
- 2337 S Shady Ln
- 2337 S State Route 53
- 2336 S State Route 53
- 2119 S State Route 53
- 2338 S Shady Ln
- 2346 S State Route 53
- 2360 S Shady Ln
- 2085 S State Route 53
- 2373 S State Route 53
- 2366 S State Route 53
- 2366 St Rte 53
- 2366 Ohio 53
- 2380 S Shady Ln