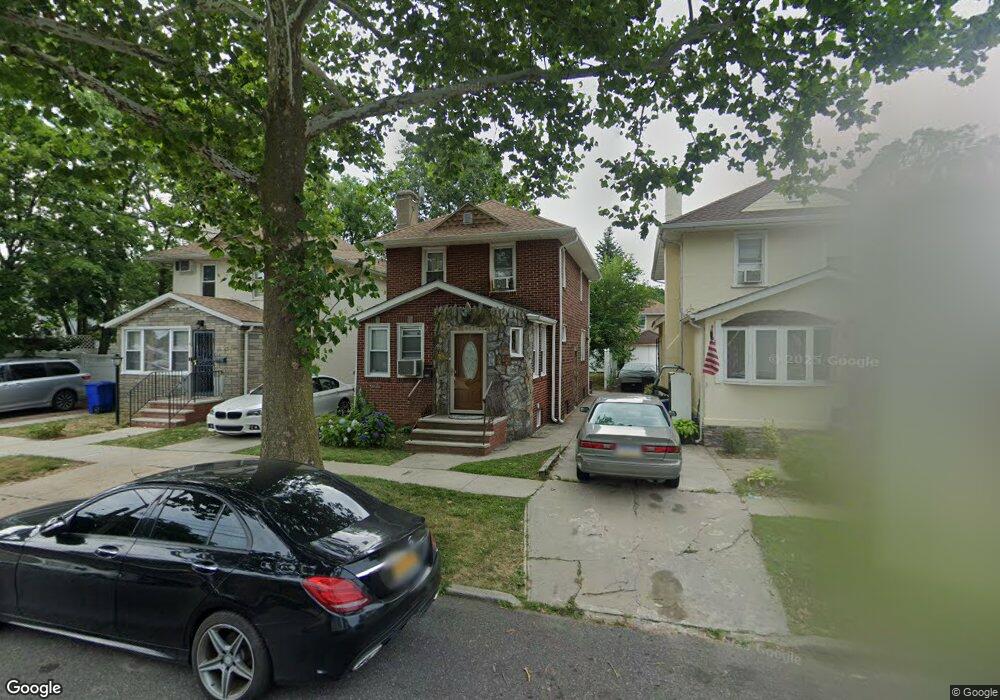
22230 99th Ave Queens Village, NY 11429
Queens Village NeighborhoodEstimated Value: $621,511 - $805,000
--
Bed
--
Bath
1,228
Sq Ft
$572/Sq Ft
Est. Value
About This Home
This home is located at 22230 99th Ave, Queens Village, NY 11429 and is currently estimated at $702,628, approximately $572 per square foot. 22230 99th Ave is a home located in Queens County with nearby schools including P.S. Is 295, Jean Nuzzi Intermediate School, and Ss Joachim & Anne School.
Ownership History
Date
Name
Owned For
Owner Type
Purchase Details
Closed on
Nov 23, 2012
Sold by
Newark Daphne and Newark Michael
Bought by
Newark Daphne
Current Estimated Value
Purchase Details
Closed on
Feb 16, 2006
Sold by
Dixon Nedrick
Bought by
Newark Daphne and Newark Michael
Home Financials for this Owner
Home Financials are based on the most recent Mortgage that was taken out on this home.
Original Mortgage
$200,000
Interest Rate
6.16%
Mortgage Type
Purchase Money Mortgage
Purchase Details
Closed on
Jun 29, 1998
Sold by
Dixon Nedrick N
Bought by
Dixon Nedrick and Holness Angela
Home Financials for this Owner
Home Financials are based on the most recent Mortgage that was taken out on this home.
Original Mortgage
$192,000
Interest Rate
6.9%
Purchase Details
Closed on
Jun 30, 1995
Sold by
Rite Properties Ltd
Bought by
Dixon Nedrick H
Home Financials for this Owner
Home Financials are based on the most recent Mortgage that was taken out on this home.
Original Mortgage
$155,777
Interest Rate
7.56%
Mortgage Type
FHA
Create a Home Valuation Report for This Property
The Home Valuation Report is an in-depth analysis detailing your home's value as well as a comparison with similar homes in the area
Home Values in the Area
Average Home Value in this Area
Purchase History
| Date | Buyer | Sale Price | Title Company |
|---|---|---|---|
| Newark Daphne | -- | -- | |
| Newark Daphne | $455,000 | -- | |
| Dixon Nedrick | -- | -- | |
| Dixon Nedrick H | $157,000 | Commonwealth Land Title Ins |
Source: Public Records
Mortgage History
| Date | Status | Borrower | Loan Amount |
|---|---|---|---|
| Previous Owner | Newark Daphne | $200,000 | |
| Previous Owner | Dixon Nedrick | $192,000 | |
| Previous Owner | Dixon Nedrick H | $155,777 |
Source: Public Records
Tax History Compared to Growth
Tax History
| Year | Tax Paid | Tax Assessment Tax Assessment Total Assessment is a certain percentage of the fair market value that is determined by local assessors to be the total taxable value of land and additions on the property. | Land | Improvement |
|---|---|---|---|---|
| 2025 | $5,267 | $27,769 | $9,904 | $17,865 |
| 2024 | $5,267 | $26,225 | $8,785 | $17,440 |
| 2023 | $5,008 | $24,936 | $8,847 | $16,089 |
| 2022 | $4,720 | $34,500 | $12,240 | $22,260 |
| 2021 | $4,976 | $33,900 | $12,240 | $21,660 |
| 2020 | $4,898 | $31,860 | $12,240 | $19,620 |
| 2019 | $4,572 | $32,280 | $12,240 | $20,040 |
| 2018 | $4,236 | $20,780 | $9,358 | $11,422 |
| 2017 | $4,017 | $19,704 | $8,374 | $11,330 |
| 2016 | $3,939 | $19,704 | $8,374 | $11,330 |
| 2015 | $2,022 | $19,284 | $11,026 | $8,258 |
| 2014 | $2,022 | $18,212 | $12,490 | $5,722 |
Source: Public Records
Map
Nearby Homes
- 22211 100th Rd
- 97-16 222nd St
- 219-06 101st Ave
- 93-44 224th St
- 93-44/50 & 93rd rd 224th St
- 9456 225th St
- 218-27 99th Ave
- 94-40 221st St
- 218-25 101st Ave
- 9434 238th St
- 9507 239th St
- 99-10 218th St
- 94-86 218th St
- 102-20 218th Place
- 105-03 221st St Unit 3
- 104-12 219th St
- 93-50 224th St
- 105-01 225th St
- 218-34 104th Ave
- 22126 106th Ave
- 22232 99th Ave
- 22228 99th Ave
- 22232 99th Ave
- 99-16 Cross Island Pkwy
- 22226 99th Ave
- 9916 100th St
- 22231 100th Ave
- 22227 100th Ave
- 22222 99th Ave
- 22225 100th Ave
- 22220 99th Ave
- 22223 100th Ave
- 22221 100th Ave
- 22218 99th Ave
- 22217 100th Ave
- 222-17 100th Ave
- 222-17 100th Ave Unit 2
- 22214 99th Ave
- 22215 100th Ave
- 22211 100th Ave