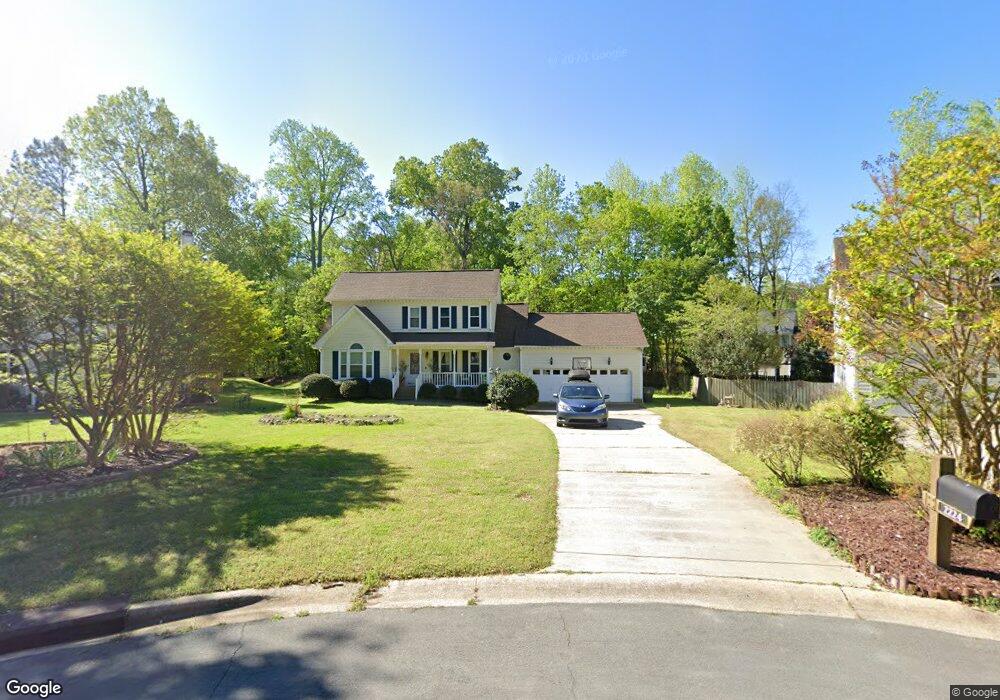
2224 Cushendun Ln Garner, NC 27529
Estimated Value: $380,000 - $391,000
3
Beds
3
Baths
1,847
Sq Ft
$209/Sq Ft
Est. Value
About This Home
This home is located at 2224 Cushendun Ln, Garner, NC 27529 and is currently estimated at $386,050, approximately $209 per square foot. 2224 Cushendun Ln is a home located in Wake County with nearby schools including Vandora Springs Elementary, North Garner Middle, and Garner High.
Ownership History
Date
Name
Owned For
Owner Type
Purchase Details
Closed on
Mar 21, 2019
Sold by
Wallace Robert F
Bought by
Wallace Claire L
Current Estimated Value
Purchase Details
Closed on
Sep 19, 2008
Sold by
Bland Hubert Elton and Bland Meredith Ward
Bought by
Wallace Robert Fox and Wallace Claire Louise
Home Financials for this Owner
Home Financials are based on the most recent Mortgage that was taken out on this home.
Original Mortgage
$147,500
Outstanding Balance
$74,358
Interest Rate
6.49%
Mortgage Type
Purchase Money Mortgage
Estimated Equity
$311,692
Purchase Details
Closed on
Oct 29, 1998
Sold by
Mozingo Donald G
Bought by
Bland Hubert Elton and Bland Meredith Ward
Home Financials for this Owner
Home Financials are based on the most recent Mortgage that was taken out on this home.
Original Mortgage
$80,000
Interest Rate
6.61%
Create a Home Valuation Report for This Property
The Home Valuation Report is an in-depth analysis detailing your home's value as well as a comparison with similar homes in the area
Home Values in the Area
Average Home Value in this Area
Purchase History
| Date | Buyer | Sale Price | Title Company |
|---|---|---|---|
| Wallace Claire L | -- | None Available | |
| Wallace Robert Fox | $185,000 | Guaranty Title Ins Agency | |
| Bland Hubert Elton | $160,000 | Fidelity National Title Ins |
Source: Public Records
Mortgage History
| Date | Status | Borrower | Loan Amount |
|---|---|---|---|
| Open | Wallace Robert Fox | $147,500 | |
| Previous Owner | Bland Hubert Elton | $80,000 |
Source: Public Records
Tax History Compared to Growth
Tax History
| Year | Tax Paid | Tax Assessment Tax Assessment Total Assessment is a certain percentage of the fair market value that is determined by local assessors to be the total taxable value of land and additions on the property. | Land | Improvement |
|---|---|---|---|---|
| 2025 | $3,575 | $342,824 | $85,000 | $257,824 |
| 2024 | $3,563 | $342,824 | $85,000 | $257,824 |
| 2023 | $3,271 | $253,191 | $53,000 | $200,191 |
| 2022 | $2,986 | $253,191 | $53,000 | $200,191 |
| 2021 | $2,836 | $253,191 | $53,000 | $200,191 |
| 2020 | $2,798 | $253,191 | $53,000 | $200,191 |
| 2019 | $2,693 | $208,687 | $48,000 | $160,687 |
| 2018 | $2,497 | $208,687 | $48,000 | $160,687 |
| 2017 | $2,415 | $208,687 | $48,000 | $160,687 |
| 2016 | $2,384 | $208,687 | $48,000 | $160,687 |
| 2015 | $2,338 | $204,767 | $44,000 | $160,767 |
| 2014 | -- | $204,767 | $44,000 | $160,767 |
Source: Public Records
Map
Nearby Homes
- 1302 Buffaloe Rd
- 2205 Moon Water Way
- 721 Thompson Rd
- 715 Thompson Rd
- 725 Thompson Rd
- 901 Edgewater Dr
- 166 Bonica Creek Dr
- 8001 Lakeshore Dr
- 100 Bonica Creek Dr
- 191 Bonica Creek Dr
- 172 Bonica Creek Dr
- 106 New Dawn Ct
- 106 Teak Cir
- 111 Clayfield Dr
- 0 Old Stage Rd
- 101 Bonica Creek Dr
- 112 Lager Ln
- 100 Lager Ln
- 122 Holyoke Ct
- 107 Coachman Dr
- 2225 Cushendun Ln
- 2220 Cushendun Ln
- 2333 Dreyfus Ct
- 2329 Dreyfus Ct
- 2221 Cushendun Ln
- 2216 Cushendun Ln
- 2325 Dreyfus Ct
- 2337 Dreyfus Ct
- 2217 Cushendun Ln
- 2321 Dreyfus Ct
- 1912 Cushendun Ln
- 2018 Gottwald Ct
- 2213 Cushendun Ln
- 2313 Dreyfus Ct
- 2341 Dreyfus Ct
- 2020 Gottwald Ct
- 2016 Gottwald Ct
- 2204 Cushendun Ln
- 1818 Lisburn Ct
- 2305 Dreyfus Ct