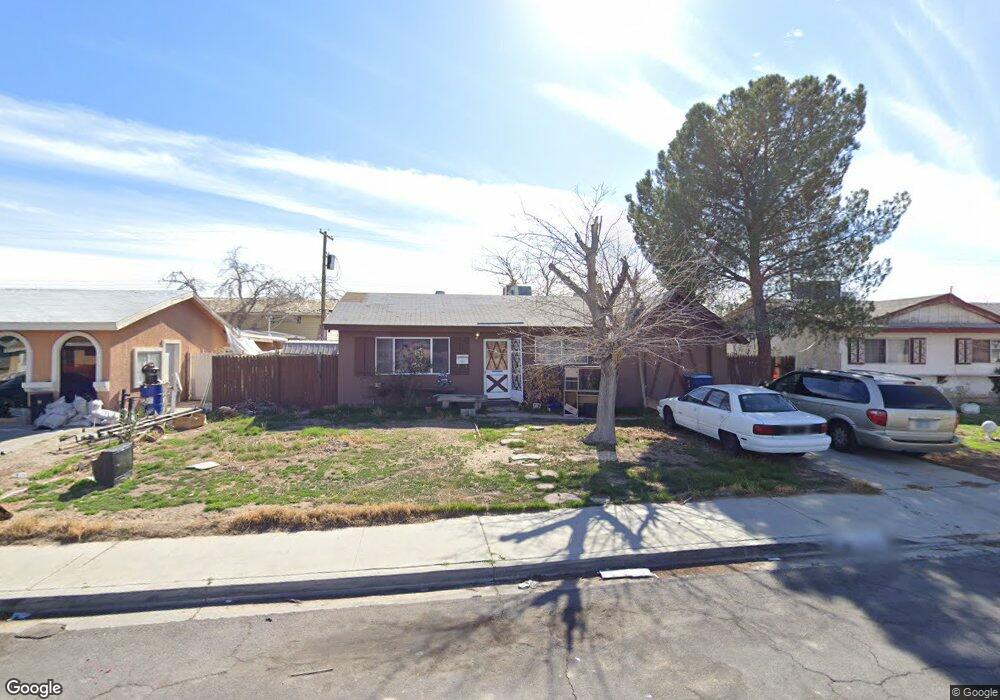
2224 Dori Ave Las Vegas, NV 89101
Downtown Las Vegas NeighborhoodEstimated Value: $269,628 - $346,000
3
Beds
1
Bath
1,039
Sq Ft
$290/Sq Ft
Est. Value
About This Home
This home is located at 2224 Dori Ave, Las Vegas, NV 89101 and is currently estimated at $301,407, approximately $290 per square foot. 2224 Dori Ave is a home located in Clark County with nearby schools including Halle Hewetson Elementary School, J.D. Smith Middle School, and Rancho High School.
Ownership History
Date
Name
Owned For
Owner Type
Purchase Details
Closed on
Jul 23, 2021
Sold by
Bos Michelle and Estate Of Lavee Bibby
Bought by
Bos Michelle
Current Estimated Value
Create a Home Valuation Report for This Property
The Home Valuation Report is an in-depth analysis detailing your home's value as well as a comparison with similar homes in the area
Home Values in the Area
Average Home Value in this Area
Purchase History
| Date | Buyer | Sale Price | Title Company |
|---|---|---|---|
| Bos Michelle | -- | None Available |
Source: Public Records
Tax History Compared to Growth
Tax History
| Year | Tax Paid | Tax Assessment Tax Assessment Total Assessment is a certain percentage of the fair market value that is determined by local assessors to be the total taxable value of land and additions on the property. | Land | Improvement |
|---|---|---|---|---|
| 2025 | $679 | $40,925 | $25,900 | $15,025 |
| 2024 | $630 | $40,925 | $25,900 | $15,025 |
| 2023 | $630 | $42,649 | $29,050 | $13,599 |
| 2022 | $583 | $35,593 | $23,450 | $12,143 |
| 2021 | $540 | $28,819 | $17,500 | $11,319 |
| 2020 | $499 | $26,756 | $15,750 | $11,006 |
| 2019 | $468 | $24,609 | $14,000 | $10,609 |
| 2018 | $446 | $22,908 | $12,950 | $9,958 |
| 2017 | $668 | $20,364 | $10,500 | $9,864 |
| 2016 | $419 | $17,610 | $8,050 | $9,560 |
| 2015 | $417 | $14,872 | $5,600 | $9,272 |
| 2014 | $405 | $12,095 | $4,200 | $7,895 |
Source: Public Records
Map
Nearby Homes
- 921 Delta St
- 828 N 21st St
- 709 N 22nd St
- 2624 Brady Ave Unit 1
- 920 E Bonanza Rd
- 2005 Jansen Ave
- 744 Mcknight St
- 2813 Willoughby Ave
- 0 Mcknight St
- 2600 E Bonanza Rd
- 1705 Leslie Ave Unit 1
- 2020 E Bonanza Rd
- 1812 Ryan Ave
- 437 N 23rd St
- 1203 Mews Ln
- 833 N Bruce St
- 2016 Linden Ave
- 828 Held Rd
- 624 N Bruce St
- 1908 Linden Ave