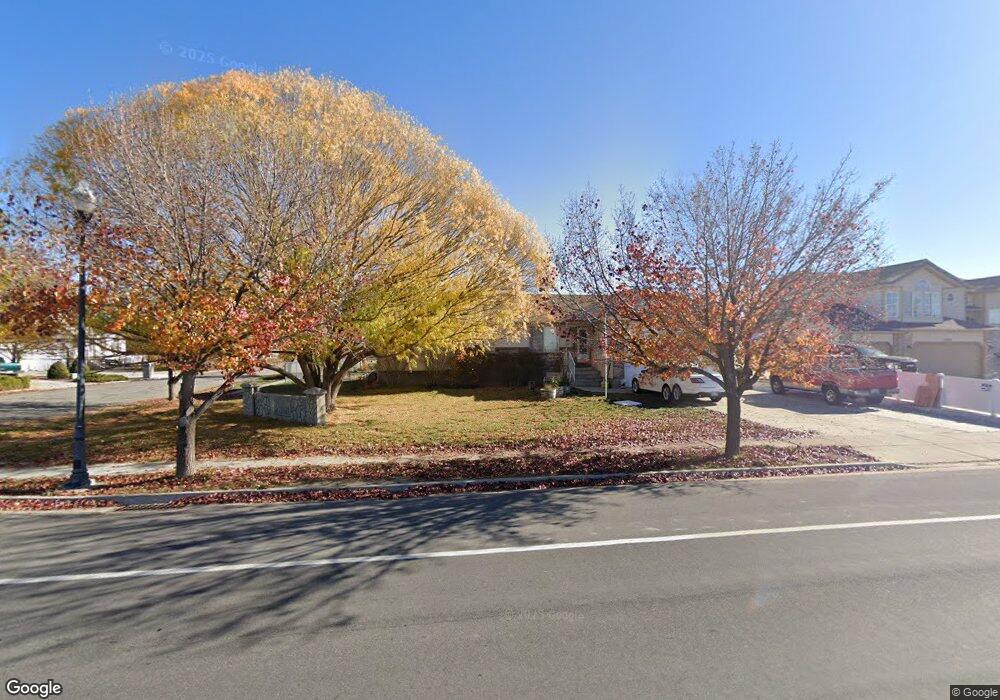
2224 N 3000 W Clinton, UT 84015
Estimated Value: $525,000 - $587,000
4
Beds
2
Baths
3,426
Sq Ft
$162/Sq Ft
Est. Value
About This Home
This home is located at 2224 N 3000 W, Clinton, UT 84015 and is currently estimated at $554,448, approximately $161 per square foot. 2224 N 3000 W is a home located in Davis County with nearby schools including West Clinton Elementary School, West Point Junior High School, and Clearfield High School.
Ownership History
Date
Name
Owned For
Owner Type
Purchase Details
Closed on
Apr 6, 2016
Sold by
Rendon David E and Rendon Vikki D
Bought by
Songer Kenneth L and Songer Alene
Current Estimated Value
Purchase Details
Closed on
May 23, 2002
Sold by
Rendon David E and Law Vikki D
Bought by
Rendon David E and Rendon Vikki D
Home Financials for this Owner
Home Financials are based on the most recent Mortgage that was taken out on this home.
Original Mortgage
$148,016
Interest Rate
6.89%
Mortgage Type
FHA
Purchase Details
Closed on
Mar 14, 2001
Sold by
Woodside Homes Corp
Bought by
Rendon David E and Law Vikki D
Home Financials for this Owner
Home Financials are based on the most recent Mortgage that was taken out on this home.
Original Mortgage
$145,829
Interest Rate
7.11%
Mortgage Type
FHA
Create a Home Valuation Report for This Property
The Home Valuation Report is an in-depth analysis detailing your home's value as well as a comparison with similar homes in the area
Home Values in the Area
Average Home Value in this Area
Purchase History
| Date | Buyer | Sale Price | Title Company |
|---|---|---|---|
| Songer Kenneth L | -- | Magellan Title | |
| Rendon David E | -- | Inwest Title Services Inc | |
| Rendon David E | -- | First American Title Co |
Source: Public Records
Mortgage History
| Date | Status | Borrower | Loan Amount |
|---|---|---|---|
| Previous Owner | Rendon David E | $148,016 | |
| Previous Owner | Rendon David E | $145,829 |
Source: Public Records
Tax History Compared to Growth
Tax History
| Year | Tax Paid | Tax Assessment Tax Assessment Total Assessment is a certain percentage of the fair market value that is determined by local assessors to be the total taxable value of land and additions on the property. | Land | Improvement |
|---|---|---|---|---|
| 2025 | $776 | $283,250 | $93,600 | $189,650 |
| 2024 | $707 | $270,600 | $101,053 | $169,547 |
| 2023 | $650 | $465,000 | $131,335 | $333,665 |
| 2022 | $1,670 | $278,850 | $76,011 | $202,839 |
| 2021 | $1,209 | $378,000 | $102,546 | $275,454 |
| 2020 | $911 | $330,000 | $91,292 | $238,708 |
| 2019 | $839 | $313,000 | $99,078 | $213,922 |
| 2018 | $700 | $287,000 | $82,735 | $204,265 |
| 2016 | $1,673 | $120,450 | $33,046 | $87,404 |
| 2015 | $1,661 | $113,685 | $33,046 | $80,639 |
| 2014 | $1,664 | $115,675 | $33,046 | $82,629 |
| 2013 | -- | $107,416 | $27,600 | $79,816 |
Source: Public Records
Map
Nearby Homes
- 339 N 3250 W Unit 12
- 3298 W 2300 N
- 1958 N 2750 W
- 3033 W 2600 N
- 3941 W 1800 N
- 3027 W 2600 N
- 3186 W 2600 N
- 3068 W 2600 N
- 2542 N 3300 W
- 3016 W 2650 N
- 2322 N 2500 W
- 6052 S 4275 W
- Harvard Plan at Summerfield - Enclave
- 2208 W 2615 N
- Linden Plan at Summerfield - Vista
- Yale Plan at Summerfield - Enclave
- Gambel Oak Plan at Summerfield - Vista
- Cedar Plan at Summerfield - Vista
- Elm Plan at Summerfield - Vista
- Princeton Plan at Summerfield - Enclave