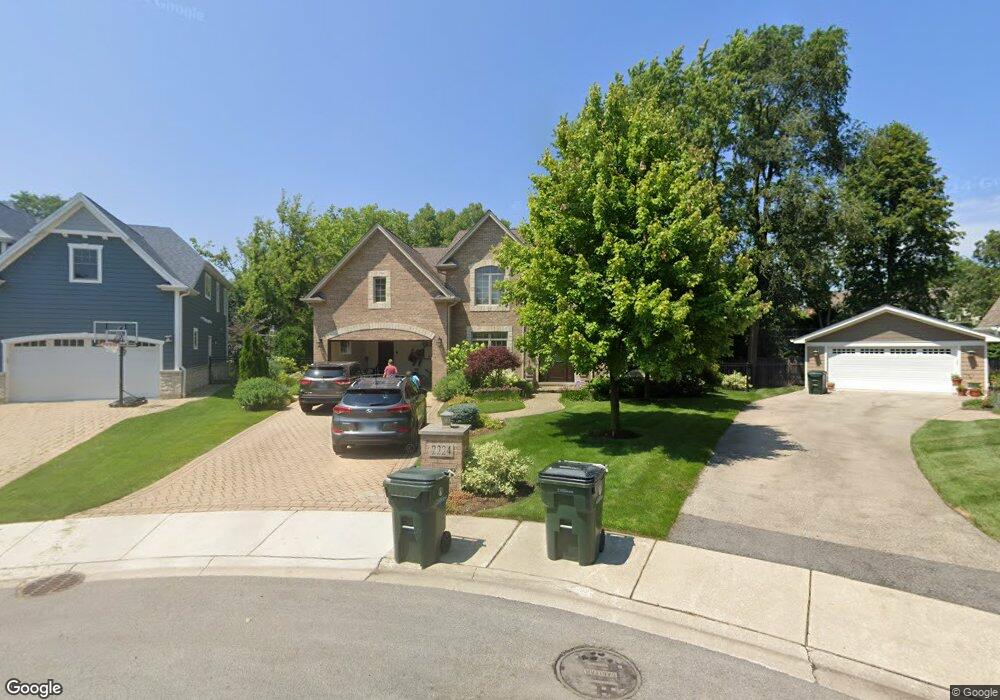
2224 Robincrest Ln Unit 6 Glenview, IL 60025
Estimated Value: $1,458,018 - $2,010,000
6
Beds
6
Baths
3,213
Sq Ft
$514/Sq Ft
Est. Value
About This Home
This home is located at 2224 Robincrest Ln Unit 6, Glenview, IL 60025 and is currently estimated at $1,651,755, approximately $514 per square foot. 2224 Robincrest Ln Unit 6 is a home located in Cook County with nearby schools including Hoffman Elementary School, Henking Elementary School, and Springman Middle School.
Ownership History
Date
Name
Owned For
Owner Type
Purchase Details
Closed on
Jun 15, 2011
Sold by
Monie Babu and Etikala Jyotsna
Bought by
Kilsdonk Jason T and Kilsdonk Lindsey M
Current Estimated Value
Home Financials for this Owner
Home Financials are based on the most recent Mortgage that was taken out on this home.
Original Mortgage
$400,000
Outstanding Balance
$27,319
Interest Rate
4.67%
Mortgage Type
New Conventional
Estimated Equity
$1,624,436
Purchase Details
Closed on
May 19, 2003
Sold by
Callahan Robert I and Callahan Josephine
Bought by
Monie Babu
Home Financials for this Owner
Home Financials are based on the most recent Mortgage that was taken out on this home.
Original Mortgage
$263,200
Interest Rate
4.37%
Mortgage Type
Unknown
Purchase Details
Closed on
Sep 4, 1998
Sold by
Callahan Robert J and Callahan Josephine
Bought by
Callahan Robert J and Callahan Josephine
Create a Home Valuation Report for This Property
The Home Valuation Report is an in-depth analysis detailing your home's value as well as a comparison with similar homes in the area
Home Values in the Area
Average Home Value in this Area
Purchase History
| Date | Buyer | Sale Price | Title Company |
|---|---|---|---|
| Kilsdonk Jason T | $1,030,000 | First American Title | |
| Monie Babu | $329,000 | -- | |
| Monie Babu | $329,000 | -- | |
| Callahan Robert J | -- | -- |
Source: Public Records
Mortgage History
| Date | Status | Borrower | Loan Amount |
|---|---|---|---|
| Open | Kilsdonk Jason T | $400,000 | |
| Previous Owner | Monie Babu | $263,200 | |
| Closed | Monie Babu | $32,900 |
Source: Public Records
Tax History Compared to Growth
Tax History
| Year | Tax Paid | Tax Assessment Tax Assessment Total Assessment is a certain percentage of the fair market value that is determined by local assessors to be the total taxable value of land and additions on the property. | Land | Improvement |
|---|---|---|---|---|
| 2024 | $20,553 | $96,176 | $15,144 | $81,032 |
| 2023 | $19,951 | $96,176 | $15,144 | $81,032 |
| 2022 | $19,951 | $96,176 | $15,144 | $81,032 |
| 2021 | $18,782 | $78,792 | $11,594 | $67,198 |
| 2020 | $18,616 | $78,792 | $11,594 | $67,198 |
| 2019 | $17,345 | $86,585 | $11,594 | $74,991 |
| 2018 | $17,303 | $78,668 | $10,174 | $68,494 |
| 2017 | $16,855 | $78,668 | $10,174 | $68,494 |
| 2016 | $16,112 | $78,668 | $10,174 | $68,494 |
| 2015 | $14,806 | $64,798 | $8,281 | $56,517 |
| 2014 | $19,604 | $86,428 | $8,281 | $78,147 |
| 2013 | $18,993 | $86,428 | $8,281 | $78,147 |
Source: Public Records
Map
Nearby Homes
- 517 Briarhill Ln
- 2137 Glenview Rd
- 315 Lincoln St
- 1821 George Ct
- 1088 Shermer Rd Unit DW
- 1800 Dewes St Unit 305
- 1800 Dewes St Unit 201
- 1800 Dewes St Unit 309
- 2121 Fir St
- 245 Nora Ave
- 2700 Fontana Dr
- 137 Julie Dr
- 216 Flora Ave
- 316 Nellie Ct
- 51 James Ct
- 609 Carriage Hill Dr
- 601 Carriage Hill Dr
- 203 Valerie Ct
- 1220 Depot St Unit 305
- 1220 Depot St Unit 109
- 2226 Robincrest Ln Unit 6
- 2222 Robincrest Ln
- 2221 Larkdale Dr Unit 1
- 2215 Larkdale Dr Unit 1
- 2228 Robincrest Ln
- 2220 Robincrest Ln
- 2227 Larkdale Dr Unit 1
- 2209 Larkdale Dr
- 2230 Robincrest Ln
- 2252 Robincrest Ln
- 2300 Robincrest Ln
- 2203 Larkdale Dr
- 2233 Larkdale Dr
- 650 Spruce St
- 2210 Robincrest Ln
- 2250 Robincrest Ln
- 700 Spruce St
- 2223 Robincrest Ln
- 2302 Robincrest Ln
- 2240 Robincrest Ln