2224 Sedge St Unit B Lynden, WA 98264
Estimated Value: $725,090 - $991,000
3
Beds
2
Baths
1,300
Sq Ft
$668/Sq Ft
Est. Value
About This Home
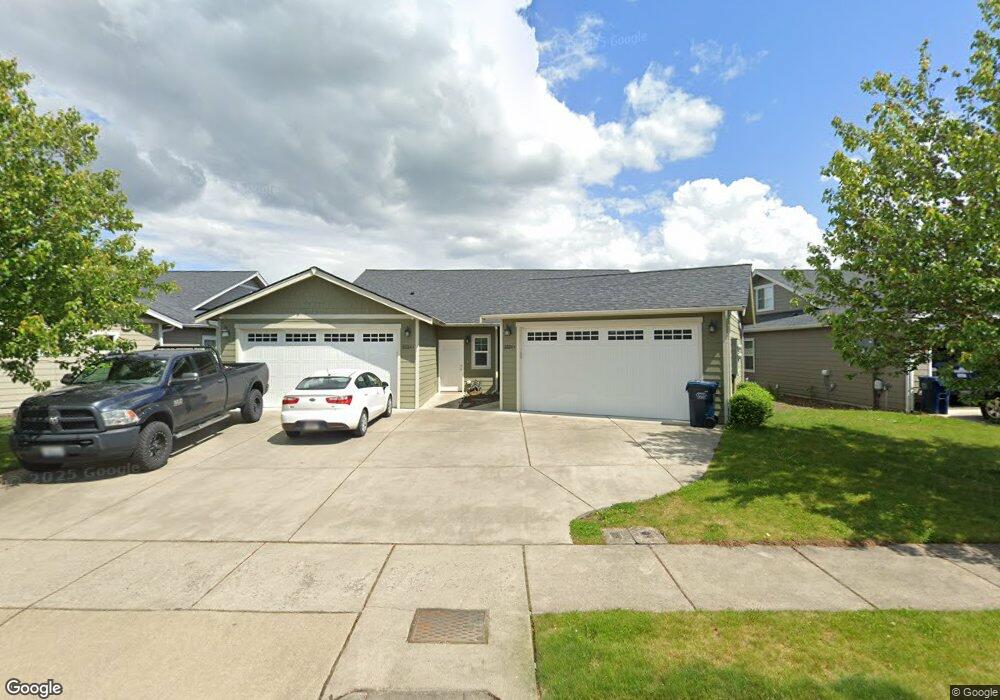
This home is located at 2224 Sedge St Unit B, Lynden, WA 98264 and is currently estimated at $868,523, approximately $668 per square foot. 2224 Sedge St Unit B is a home located in Whatcom County with nearby schools including Lynden High School, Cornerstone Christian School, and Covenant Christian School.
Ownership History
Date
Name
Owned For
Owner Type
Purchase Details
Closed on
Sep 28, 2021
Sold by
Haak Keenan and Zima Blake
Bought by
Scofidio Rob and Scofidio Angelka
Current Estimated Value
Home Financials for this Owner
Home Financials are based on the most recent Mortgage that was taken out on this home.
Original Mortgage
$185,000
Outstanding Balance
$168,703
Interest Rate
2.8%
Mortgage Type
New Conventional
Estimated Equity
$699,820
Purchase Details
Closed on
Jan 3, 2020
Sold by
Haak Heidy M
Bought by
Haak Keenan
Home Financials for this Owner
Home Financials are based on the most recent Mortgage that was taken out on this home.
Original Mortgage
$420,000
Interest Rate
3.6%
Mortgage Type
New Conventional
Purchase Details
Closed on
Jan 7, 2019
Sold by
Navis Roger and Navis Cynthia
Bought by
Sedge Properties Llc
Purchase Details
Closed on
Mar 16, 2016
Sold by
North Prairie Llc
Bought by
Navis Roger and Navis Cindy
Create a Home Valuation Report for This Property
The Home Valuation Report is an in-depth analysis detailing your home's value as well as a comparison with similar homes in the area
Home Values in the Area
Average Home Value in this Area
Purchase History
| Date | Buyer | Sale Price | Title Company |
|---|---|---|---|
| Scofidio Rob | $795,000 | Chicago Title Bellingham | |
| Haak Keenan | -- | Whatcom Land Title | |
| Haak Keenan | $525,000 | Whatcom Land Title | |
| Sedge Properties Llc | -- | Accommodation | |
| Navis Roger | $100,000 | First American Title |
Source: Public Records
Mortgage History
| Date | Status | Borrower | Loan Amount |
|---|---|---|---|
| Open | Scofidio Rob | $185,000 | |
| Previous Owner | Haak Keenan | $420,000 |
Source: Public Records
Tax History Compared to Growth
Tax History
| Year | Tax Paid | Tax Assessment Tax Assessment Total Assessment is a certain percentage of the fair market value that is determined by local assessors to be the total taxable value of land and additions on the property. | Land | Improvement |
|---|---|---|---|---|
| 2024 | $4,515 | $637,353 | $218,250 | $419,103 |
| 2023 | $4,515 | $627,984 | $225,000 | $402,984 |
| 2022 | $5,093 | $668,387 | $198,561 | $469,826 |
| 2021 | $4,996 | $552,379 | $164,098 | $388,281 |
| 2020 | $4,377 | $493,209 | $146,520 | $346,689 |
| 2019 | $3,894 | $452,328 | $134,530 | $317,798 |
| 2018 | $4,256 | $412,526 | $122,551 | $289,975 |
| 2017 | $3,697 | $370,277 | $110,000 | $260,277 |
| 2016 | $1,048 | $342,062 | $110,000 | $232,062 |
| 2015 | -- | $96,600 | $96,600 | $0 |
Source: Public Records
Map
Nearby Homes
- 8865 Northwood Rd
- 2021 Brome St
- 2029 Brome St
- 2202 Berryman Loop
- 1725 Aaron Dr
- 2014 Monteview Ct
- 8885 Line Rd
- 2105 Lagerwey Cir
- 2103 Lagerwey Cir
- 1340 Kamm Rd
- 2163 Lagerwey Cir
- 2205 Dejong Dr
- 2201 Dejong Dr
- 2080 Bowfin Way
- 1792 Bradley Rd
- 1402 Bradley Meadows Ln
- 1660 Eastwood Way
- 1319 Bradley Ct
- 1136 N Cascade Ct
- 1112 N Cascade Ct
- 2224 Sedge St
- 2222 Sedge St
- 2210 Sedge St
- 2238 Sedge St
- 2202 Sedge St
- 2202 Sedge St Unit A
- 2256 Sedge St
- 2005 Aaron Dr
- 2005 Aaron Dr Unit 201
- 2005 Aaron Dr Unit 202
- 2239 Sedge St
- 2227 Sedge St
- 2215 Sedge St
- 2203 Sedge St
- 2777 Sedge St
- 2251 Sedge St
- 1986 N Prairie Ln
- 9 N Prairie Ln
- 1992 Aaron Dr
- 2025 Aaron Dr