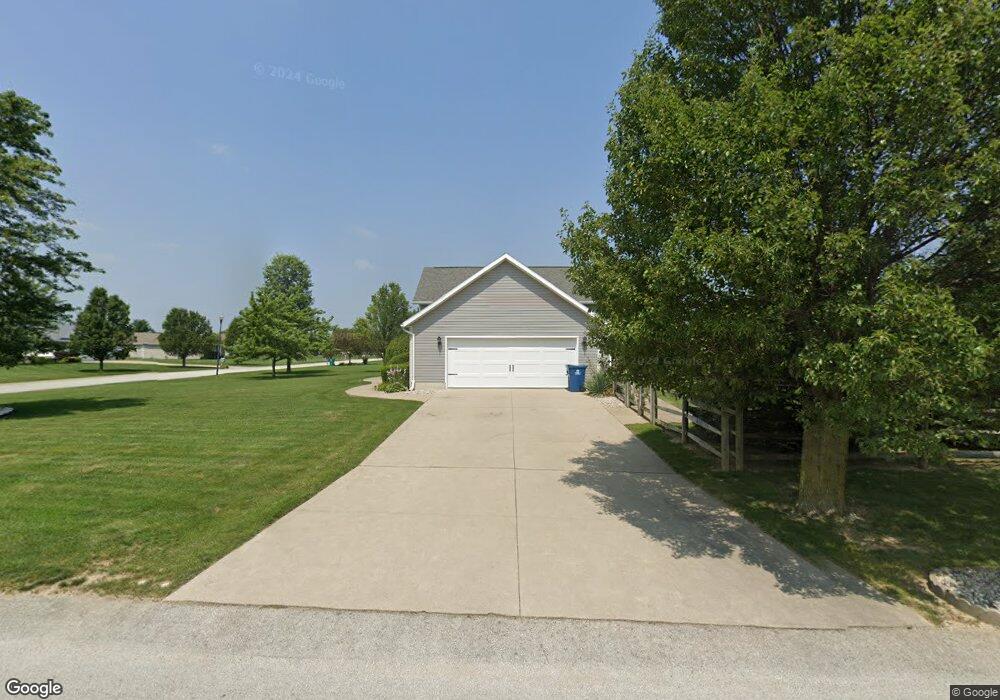
22245 Hollyhock Ln Curtice, OH 43412
Estimated Value: $371,327 - $497,000
4
Beds
3
Baths
2,024
Sq Ft
$211/Sq Ft
Est. Value
About This Home
This home is located at 22245 Hollyhock Ln, Curtice, OH 43412 and is currently estimated at $427,082, approximately $211 per square foot. 22245 Hollyhock Ln is a home located in Ottawa County with nearby schools including Genoa Elementary School.
Ownership History
Date
Name
Owned For
Owner Type
Purchase Details
Closed on
Mar 2, 2021
Sold by
Sanchez Paula D
Bought by
Klink Matthew M
Current Estimated Value
Home Financials for this Owner
Home Financials are based on the most recent Mortgage that was taken out on this home.
Original Mortgage
$237,750
Outstanding Balance
$211,668
Interest Rate
2.7%
Mortgage Type
VA
Estimated Equity
$215,414
Purchase Details
Closed on
Sep 14, 2004
Sold by
Leppert James and Leppert Bertha
Bought by
Sanchez Jose H and Sanchez Paula
Purchase Details
Closed on
Sep 10, 2004
Sold by
Leppert James L and Leppert Bertha C
Bought by
Sanchez Jose H and Sanchez Paula D
Create a Home Valuation Report for This Property
The Home Valuation Report is an in-depth analysis detailing your home's value as well as a comparison with similar homes in the area
Home Values in the Area
Average Home Value in this Area
Purchase History
| Date | Buyer | Sale Price | Title Company |
|---|---|---|---|
| Klink Matthew M | $285,000 | Louisville Title Agency | |
| Sanchez Jose H | $29,000 | -- | |
| Sanchez Jose H | $29,000 | -- |
Source: Public Records
Mortgage History
| Date | Status | Borrower | Loan Amount |
|---|---|---|---|
| Open | Klink Matthew M | $237,750 |
Source: Public Records
Tax History Compared to Growth
Tax History
| Year | Tax Paid | Tax Assessment Tax Assessment Total Assessment is a certain percentage of the fair market value that is determined by local assessors to be the total taxable value of land and additions on the property. | Land | Improvement |
|---|---|---|---|---|
| 2024 | $4,579 | $98,676 | $18,725 | $79,951 |
| 2023 | $4,579 | $64,866 | $9,846 | $55,020 |
| 2022 | $3,458 | $64,866 | $9,846 | $55,020 |
| 2021 | $3,002 | $64,870 | $9,850 | $55,020 |
| 2020 | $2,914 | $59,740 | $9,850 | $49,890 |
| 2019 | $2,890 | $59,740 | $9,850 | $49,890 |
| 2018 | $2,789 | $59,740 | $9,850 | $49,890 |
| 2017 | $2,619 | $53,010 | $9,850 | $43,160 |
| 2016 | $2,623 | $53,010 | $9,850 | $43,160 |
| 2015 | $2,639 | $53,010 | $9,850 | $43,160 |
| 2014 | $2,309 | $50,160 | $9,850 | $40,310 |
| 2013 | $2,286 | $50,160 | $9,850 | $40,310 |
Source: Public Records
Map
Nearby Homes
- 6927 N Wildacre Rd
- 21224 W Toledo St
- 7330 Jerusalem Rd
- 0 W Walbridge Rd
- Track 1 W Walbridge Rd
- 19367 W Walbridge Rd
- 24181 W James Ridge Rd
- 6645 Seaman Rd
- 5401 Pickle Rd
- 9015 Seaman Rd
- 5300 Williston Rd
- 445 S Yondota Rd
- 180 S Stadium Rd
- 6530 Corduroy Rd
- 5101 Wynn Park Dr
- 730 Bradner Rd
- 4777 Williston Rd
- 29453 Harriet St
- 5415 Seaman Rd
- 1031 N Cousino Rd
- 22245 W Hollyhock Ln
- 6601 Goldenrod Ct
- 6580 Bellflower Ct
- 22252 Hollyhock Ln
- 6600 Bellflower Ct
- 22232 Hollyhock Ln
- 6631 Goldenrod Ct
- 22289 Hollyhock Ln
- 6600 Goldenrod Ct
- 22278 Hollyhock Ln
- 6630 Bellflower Ct
- 22204 Hollyhock Ln
- 6630 Goldenrod Ct
- 6661 Goldenrod Ct
- 22302 Hollyhock Ln
- 6660 Bellflower Ct
- 22232 W Red Clover Ln
- 22182 Hollyhock Ln
- 6660 Goldenrod Ct