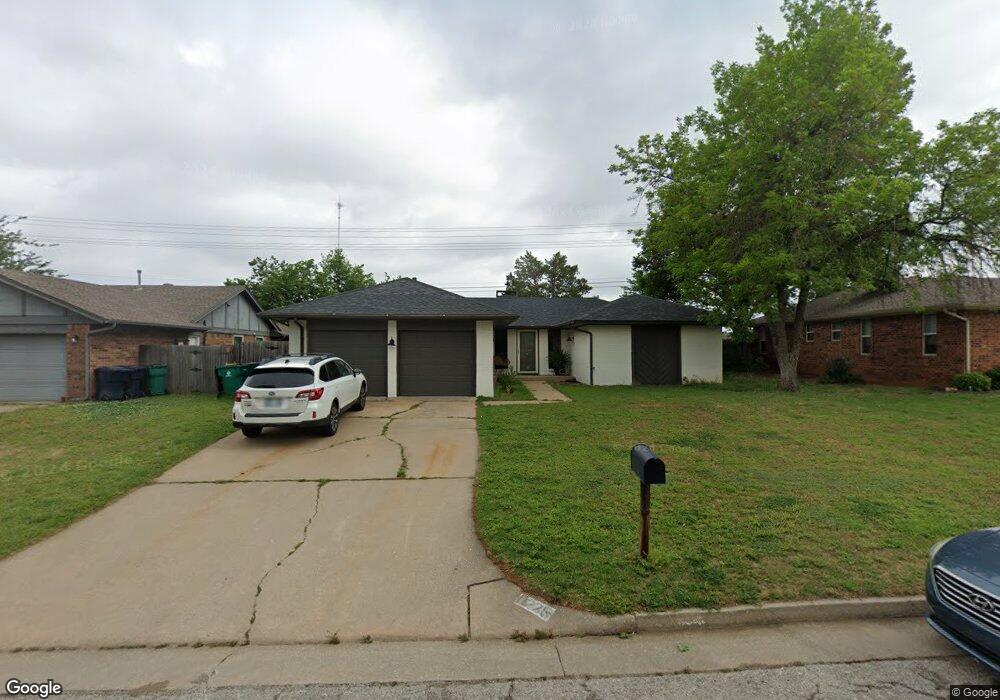
2225 Butternut Place Edmond, OK 73013
Smiling Hill/Whispering Heights NeighborhoodEstimated Value: $236,267 - $259,000
3
Beds
2
Baths
1,613
Sq Ft
$153/Sq Ft
Est. Value
About This Home
This home is located at 2225 Butternut Place, Edmond, OK 73013 and is currently estimated at $247,567, approximately $153 per square foot. 2225 Butternut Place is a home located in Oklahoma County with nearby schools including Orvis Risner Elementary School, Cimarron Middle School, and Memorial High School.
Ownership History
Date
Name
Owned For
Owner Type
Purchase Details
Closed on
Dec 28, 2021
Sold by
B & R Holdings Llc
Bought by
Jeannes Dustin C
Current Estimated Value
Home Financials for this Owner
Home Financials are based on the most recent Mortgage that was taken out on this home.
Original Mortgage
$160,000
Outstanding Balance
$147,344
Interest Rate
3.05%
Mortgage Type
New Conventional
Estimated Equity
$100,223
Purchase Details
Closed on
Feb 15, 2012
Sold by
Rice Barry T and Rice Kylee
Bought by
B & R Holdings Llc
Purchase Details
Closed on
Jan 16, 2011
Sold by
Rice Brian L and Rice Vicki R
Bought by
Rice Robert O and Rice Barry T
Home Financials for this Owner
Home Financials are based on the most recent Mortgage that was taken out on this home.
Original Mortgage
$92,500
Interest Rate
4.78%
Mortgage Type
Seller Take Back
Purchase Details
Closed on
Jan 1, 2009
Sold by
Dyer Paul L and Dyer Carol Ann
Bought by
Prism Energy Inc
Create a Home Valuation Report for This Property
The Home Valuation Report is an in-depth analysis detailing your home's value as well as a comparison with similar homes in the area
Home Values in the Area
Average Home Value in this Area
Purchase History
| Date | Buyer | Sale Price | Title Company |
|---|---|---|---|
| Jeannes Dustin C | $200,000 | American Eagle Title Group | |
| B & R Holdings Llc | -- | None Available | |
| Rice Robert O | $90,000 | None Available | |
| Prism Energy Inc | $41,000 | None Available |
Source: Public Records
Mortgage History
| Date | Status | Borrower | Loan Amount |
|---|---|---|---|
| Open | Jeannes Dustin C | $160,000 | |
| Previous Owner | Rice Robert O | $92,500 |
Source: Public Records
Tax History Compared to Growth
Tax History
| Year | Tax Paid | Tax Assessment Tax Assessment Total Assessment is a certain percentage of the fair market value that is determined by local assessors to be the total taxable value of land and additions on the property. | Land | Improvement |
|---|---|---|---|---|
| 2024 | $2,708 | $23,890 | $3,644 | $20,246 |
| 2023 | $2,708 | $22,753 | $3,566 | $19,187 |
| 2022 | $2,603 | $21,670 | $3,783 | $17,887 |
| 2021 | $1,963 | $16,516 | $2,706 | $13,810 |
| 2020 | $1,898 | $15,730 | $2,721 | $13,009 |
| 2019 | $1,871 | $15,419 | $2,630 | $12,789 |
| 2018 | $1,792 | $14,685 | $0 | $0 |
| 2017 | $1,828 | $15,069 | $2,594 | $12,475 |
| 2016 | $1,778 | $14,739 | $2,594 | $12,145 |
| 2015 | $1,773 | $14,611 | $2,594 | $12,017 |
| 2014 | $1,688 | $13,948 | $2,594 | $11,354 |
Source: Public Records
Map
Nearby Homes
- 2328 Butternut Place
- 2401 Butternut Place
- 2321 Pinon Place
- 13425 Creek Pointe Ln
- 13400 Cedar Pointe Dr
- 2437 Shady Tree Ln
- 13504 Fox Creek Dr
- 13500 Fox Creek Dr
- 13308 Creekside Dr
- 16308 Marsha Dr
- 13500 Green Cedar Ln
- 3809 Grandview Terrace
- 1204 Sims Ave
- 2817 Shady Tree Ln
- 4632 Olde Village Cir
- 2912 NE 133rd St
- 3612 Meadow Ln
- 3732 Bonaire Place
- 13800 Crossing Way E
- 13209 Golden Eagle Dr
- 2221 Butternut Place
- 2229 Butternut Place
- 2233 Butternut Place
- 2217 Butternut Place
- 2224 Butternut Place
- 2220 Butternut Place
- 2301 Butternut Place
- 2232 Butternut Place
- 2216 Butternut Place
- 2300 Butternut Place
- 2225 Red Elm Dr
- 2212 Butternut Place
- 2229 Red Elm Dr
- 2305 Butternut Place
- 2209 Butternut Place
- 2221 Red Elm Dr
- 2304 Butternut Place
- 2217 Red Elm Dr
- 2208 Butternut Place
- 2309 Butternut Place