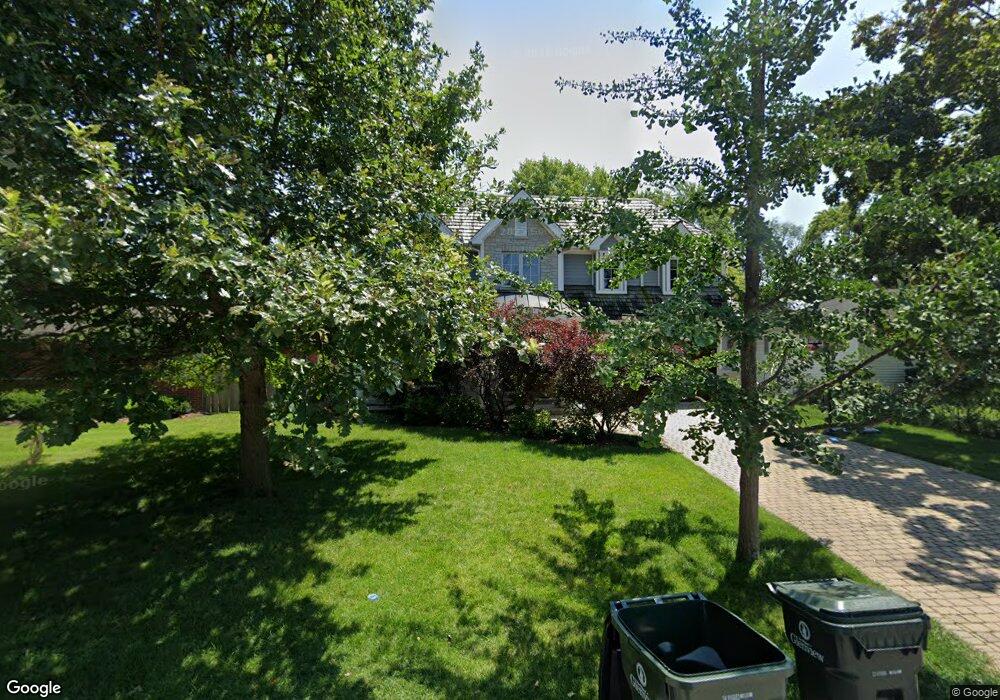
2225 Covert Rd Glenview, IL 60025
Estimated Value: $1,294,000 - $1,564,000
4
Beds
5
Baths
3,394
Sq Ft
$433/Sq Ft
Est. Value
About This Home
This home is located at 2225 Covert Rd, Glenview, IL 60025 and is currently estimated at $1,470,969, approximately $433 per square foot. 2225 Covert Rd is a home located in Cook County with nearby schools including Hoffman Elementary School, Henking Elementary School, and Springman Middle School.
Ownership History
Date
Name
Owned For
Owner Type
Purchase Details
Closed on
Jan 10, 2007
Sold by
Danko Daniel and Danko Dorota A
Bought by
Johansson Krister and Johansson Katrina
Current Estimated Value
Home Financials for this Owner
Home Financials are based on the most recent Mortgage that was taken out on this home.
Original Mortgage
$946,400
Outstanding Balance
$565,566
Interest Rate
6.21%
Mortgage Type
Unknown
Estimated Equity
$905,403
Purchase Details
Closed on
Aug 18, 2005
Sold by
William J Foley Living Trust
Bought by
Danko Daniel and Danko Dorota A
Home Financials for this Owner
Home Financials are based on the most recent Mortgage that was taken out on this home.
Original Mortgage
$355,500
Interest Rate
7.65%
Mortgage Type
Fannie Mae Freddie Mac
Purchase Details
Closed on
Jul 7, 2001
Sold by
Foley William J
Bought by
Foley William J and William J Foley Living Trust
Create a Home Valuation Report for This Property
The Home Valuation Report is an in-depth analysis detailing your home's value as well as a comparison with similar homes in the area
Home Values in the Area
Average Home Value in this Area
Purchase History
| Date | Buyer | Sale Price | Title Company |
|---|---|---|---|
| Johansson Krister | $1,183,000 | Chicago Title Insurance Co | |
| Danko Daniel | $395,000 | Multiple | |
| Foley William J | -- | -- |
Source: Public Records
Mortgage History
| Date | Status | Borrower | Loan Amount |
|---|---|---|---|
| Open | Johansson Krister | $946,400 | |
| Previous Owner | Danko Daniel | $355,500 |
Source: Public Records
Tax History Compared to Growth
Tax History
| Year | Tax Paid | Tax Assessment Tax Assessment Total Assessment is a certain percentage of the fair market value that is determined by local assessors to be the total taxable value of land and additions on the property. | Land | Improvement |
|---|---|---|---|---|
| 2024 | $20,302 | $94,543 | $10,440 | $84,103 |
| 2023 | $22,842 | $109,000 | $10,440 | $98,560 |
| 2022 | $22,842 | $109,000 | $10,440 | $98,560 |
| 2021 | $13,108 | $55,616 | $8,948 | $46,668 |
| 2020 | $12,912 | $55,616 | $8,948 | $46,668 |
| 2019 | $15,092 | $75,674 | $8,948 | $66,726 |
| 2018 | $12,715 | $58,242 | $7,705 | $50,537 |
| 2017 | $12,453 | $58,242 | $7,705 | $50,537 |
| 2016 | $11,967 | $58,242 | $7,705 | $50,537 |
| 2015 | $14,803 | $63,908 | $6,462 | $57,446 |
| 2014 | $14,535 | $63,908 | $6,462 | $57,446 |
| 2013 | $14,081 | $63,908 | $6,462 | $57,446 |
Source: Public Records
Map
Nearby Homes
- 517 Briarhill Ln
- 315 Lincoln St
- 1821 George Ct
- 137 Julie Dr
- 51 James Ct
- 216 Flora Ave
- 245 Nora Ave
- 2700 Fontana Dr
- 2137 Glenview Rd
- 316 Nellie Ct
- 203 Valerie Ct
- 2521 Gayle Ct
- 7324 Palma Ln
- 2740 Norma Ct
- 1088 Shermer Rd Unit DW
- 2821 Covert Rd
- 1800 Dewes St Unit 305
- 1800 Dewes St Unit 201
- 1800 Dewes St Unit 309
- 521 Michael Manor
- 2231 Covert Rd
- 2235 Covert Rd
- 2241 Covert Rd
- 2220 Covert Rd
- 438 Briarhill Ln
- 2234 Grandview Place
- 2232 Covert Rd
- 2232 Grandview Place
- 2245 Covert Rd
- 507 Briarhill Ln
- 511 Briarhill Ln
- 436 Briarhill Ln
- 2238 Grandview Place
- 503 Briarhill Ln
- 2238 Covert Rd
- 526 Briarhill Ln
- 2301 Covert Rd
- 443 Briarhill Ln
- 523 Briarhill Ln
- 2242 Covert Rd Unit 5