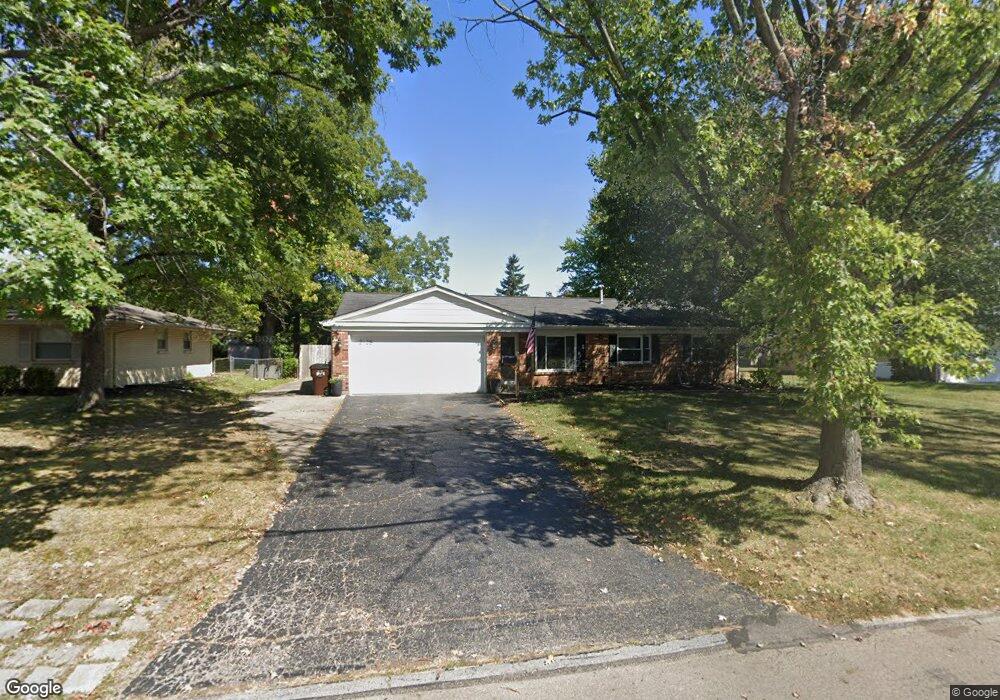
2225 Mardell Dr Dayton, OH 45459
Woodbourne-Hyde Park NeighborhoodEstimated Value: $230,000 - $254,000
3
Beds
2
Baths
1,255
Sq Ft
$191/Sq Ft
Est. Value
About This Home
This home is located at 2225 Mardell Dr, Dayton, OH 45459 and is currently estimated at $240,291, approximately $191 per square foot. 2225 Mardell Dr is a home located in Montgomery County with nearby schools including Miamisburg High School, Bishop Leibold School, and Alexandria Montessori School.
Ownership History
Date
Name
Owned For
Owner Type
Purchase Details
Closed on
Dec 27, 2017
Sold by
Malley Annie B O and Weatherspoon Frank B
Bought by
Allen Eric T
Current Estimated Value
Home Financials for this Owner
Home Financials are based on the most recent Mortgage that was taken out on this home.
Original Mortgage
$110,900
Outstanding Balance
$93,491
Interest Rate
3.9%
Mortgage Type
Purchase Money Mortgage
Estimated Equity
$146,800
Purchase Details
Closed on
Sep 28, 2001
Sold by
Piper Jeffrey L and Piper Vicky L
Bought by
Weatherspoon Frank B and Weatherspoon Annie B
Home Financials for this Owner
Home Financials are based on the most recent Mortgage that was taken out on this home.
Original Mortgage
$116,975
Interest Rate
6.99%
Mortgage Type
FHA
Purchase Details
Closed on
Sep 29, 1994
Sold by
Bereda Jon Scott
Bought by
Piper Jeffrey L and Piper Vicky L
Create a Home Valuation Report for This Property
The Home Valuation Report is an in-depth analysis detailing your home's value as well as a comparison with similar homes in the area
Home Values in the Area
Average Home Value in this Area
Purchase History
| Date | Buyer | Sale Price | Title Company |
|---|---|---|---|
| Allen Eric T | $144,000 | Landmark Title Agency South | |
| Weatherspoon Frank B | $117,900 | -- | |
| Piper Jeffrey L | -- | -- |
Source: Public Records
Mortgage History
| Date | Status | Borrower | Loan Amount |
|---|---|---|---|
| Open | Allen Eric T | $110,900 | |
| Previous Owner | Weatherspoon Frank B | $116,975 |
Source: Public Records
Tax History Compared to Growth
Tax History
| Year | Tax Paid | Tax Assessment Tax Assessment Total Assessment is a certain percentage of the fair market value that is determined by local assessors to be the total taxable value of land and additions on the property. | Land | Improvement |
|---|---|---|---|---|
| 2024 | $4,384 | $62,810 | $9,350 | $53,460 |
| 2023 | $4,384 | $62,810 | $9,350 | $53,460 |
| 2022 | $3,815 | $46,380 | $6,920 | $39,460 |
| 2021 | $3,600 | $46,380 | $6,920 | $39,460 |
| 2020 | $3,539 | $46,380 | $6,920 | $39,460 |
| 2019 | $3,213 | $38,120 | $6,920 | $31,200 |
| 2018 | $3,190 | $38,120 | $6,920 | $31,200 |
| 2017 | $3,171 | $38,120 | $6,920 | $31,200 |
| 2016 | $2,877 | $33,140 | $6,920 | $26,220 |
| 2015 | $2,829 | $33,140 | $6,920 | $26,220 |
| 2014 | $2,829 | $33,140 | $6,920 | $26,220 |
| 2012 | -- | $35,460 | $10,780 | $24,680 |
Source: Public Records
Map
Nearby Homes
- 2207 Southlea Dr
- 2334 Mardell Dr
- 7806 Washington Park Dr
- 1817 Provincetown Rd
- 2560 Delavan Dr
- 488 Crossing Ln
- 550 Crossing Ln
- 1901 Washington Dr N
- 7061 Rivendell Cir
- 7055 Rivendell Cir
- 3091 Simpson Ct
- 3057 Wellington Ln Unit 8264
- Yeats Plan at Chamberlin Crossing
- Turnbull Plan at Chamberlin Crossing
- 3052 Simpson Ct
- 3052 Simpson Ct Unit 8337
- 3091 Simpson Ct Unit 8355
- 488 Crossing Ln
- Remington Plan at Chamberlin Crossing
- 460 Crossing Ln
- 2219 Mardell Dr
- 2231 Mardell Dr
- 2213 Mardell Dr
- 2237 Mardell Dr
- 7606 Plamor Cir
- 2336 Wymore Place
- 2342 Wymore Place
- 2224 Mardell Dr
- 2207 Mardell Dr
- 2301 Mardell Dr
- 2230 Mardell Dr
- 2218 Mardell Dr
- 2348 Wymore Place
- 2236 Mardell Dr
- 2212 Mardell Dr
- 2201 Mardell Dr
- 2307 Mardell Dr
- 2300 Mardell Dr
- 2354 Wymore Place
- 2206 Mardell Dr