2226 53rd St Fennville, MI 49408
Estimated Value: $59,000 - $207,000
3
Beds
2
Baths
890
Sq Ft
$119/Sq Ft
Est. Value
About This Home
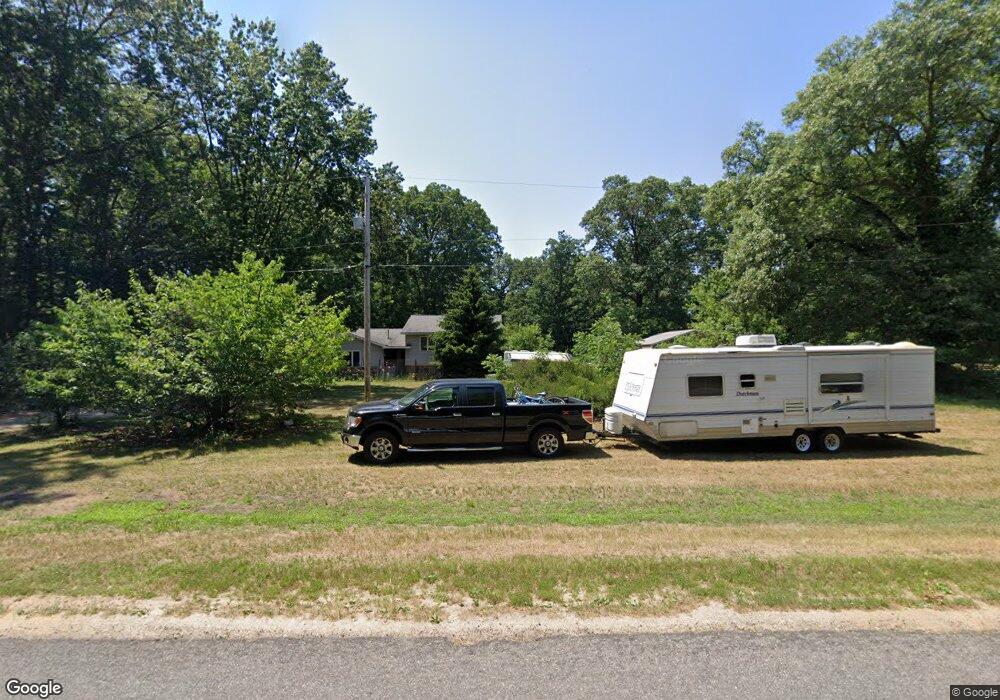
This home is located at 2226 53rd St, Fennville, MI 49408 and is currently estimated at $106,155, approximately $119 per square foot. 2226 53rd St is a home located in Allegan County with nearby schools including Fennville Elementary School, Fennville Middle School, and Fennville High School.
Ownership History
Date
Name
Owned For
Owner Type
Purchase Details
Closed on
Jan 2, 2025
Sold by
Real Estate Exchange Of Holland Inc
Bought by
Charles George W and Hernandez Ashley
Current Estimated Value
Purchase Details
Closed on
Dec 20, 2024
Sold by
Charles George W and Hernandez Ashley
Bought by
Sagestone Enterprises Llc
Purchase Details
Closed on
Jun 18, 2021
Sold by
Charles George W
Bought by
Charles George W and Hernandez Ashley
Purchase Details
Closed on
Dec 28, 2006
Sold by
Joseph Sandra L
Bought by
Real Estate Exchange Of Holland Inc
Purchase Details
Closed on
Jul 2, 2005
Sold by
Real Exchange Of Holland Inc
Bought by
Joseph Sandra L
Purchase Details
Closed on
Jun 23, 2005
Sold by
Horn Judy L and Pshea Judy L
Bought by
Real Estate Eschange Of Holland Inc
Create a Home Valuation Report for This Property
The Home Valuation Report is an in-depth analysis detailing your home's value as well as a comparison with similar homes in the area
Home Values in the Area
Average Home Value in this Area
Purchase History
| Date | Buyer | Sale Price | Title Company |
|---|---|---|---|
| Charles George W | $42,000 | None Listed On Document | |
| Charles George W | $42,000 | None Listed On Document | |
| Sagestone Enterprises Llc | $55,000 | Irongate Title | |
| Sagestone Enterprises Llc | $55,000 | Irongate Title | |
| Charles George W | -- | None Available | |
| Real Estate Exchange Of Holland Inc | -- | None Available | |
| Joseph Sandra L | -- | -- | |
| Real Estate Eschange Of Holland Inc | $45,500 | Metropolitan Title Company |
Source: Public Records
Tax History Compared to Growth
Tax History
| Year | Tax Paid | Tax Assessment Tax Assessment Total Assessment is a certain percentage of the fair market value that is determined by local assessors to be the total taxable value of land and additions on the property. | Land | Improvement |
|---|---|---|---|---|
| 2025 | $1,154 | $59,200 | $11,500 | $47,700 |
| 2024 | $899 | $46,700 | $10,600 | $36,100 |
| 2023 | $899 | $43,800 | $10,500 | $33,300 |
| 2022 | $899 | $43,200 | $9,800 | $33,400 |
| 2021 | $800 | $41,300 | $8,700 | $32,600 |
| 2020 | $800 | $38,800 | $8,300 | $30,500 |
| 2019 | $800 | $33,100 | $7,500 | $25,600 |
| 2018 | $800 | $31,600 | $6,500 | $25,100 |
| 2017 | $0 | $24,300 | $6,100 | $18,200 |
| 2016 | $0 | $18,600 | $5,500 | $13,100 |
| 2015 | -- | $18,600 | $5,500 | $13,100 |
| 2014 | -- | $18,800 | $5,500 | $13,300 |
| 2013 | -- | $17,000 | $5,500 | $11,500 |
Source: Public Records
Map
Nearby Homes
- 2334 54th St
- 5233 124th Ave
- 5395 Reveille Rd
- 2449 54th St
- 2488 Orchard Valley Dr
- 2506 52nd St
- V/L 56th St
- 715 E Main St
- 0 56th St
- 552 3rd St
- VL 56th Unit A
- 6821 124th Ave
- 5653 Landsburg Rd
- 0 Stonebridge Unit 2 25030802
- 5083 118th Ave
- 638 W Main St
- 2425 58th St
- 51263 117th Ave
- 000-D 118th Ave
- 0 118th Ave