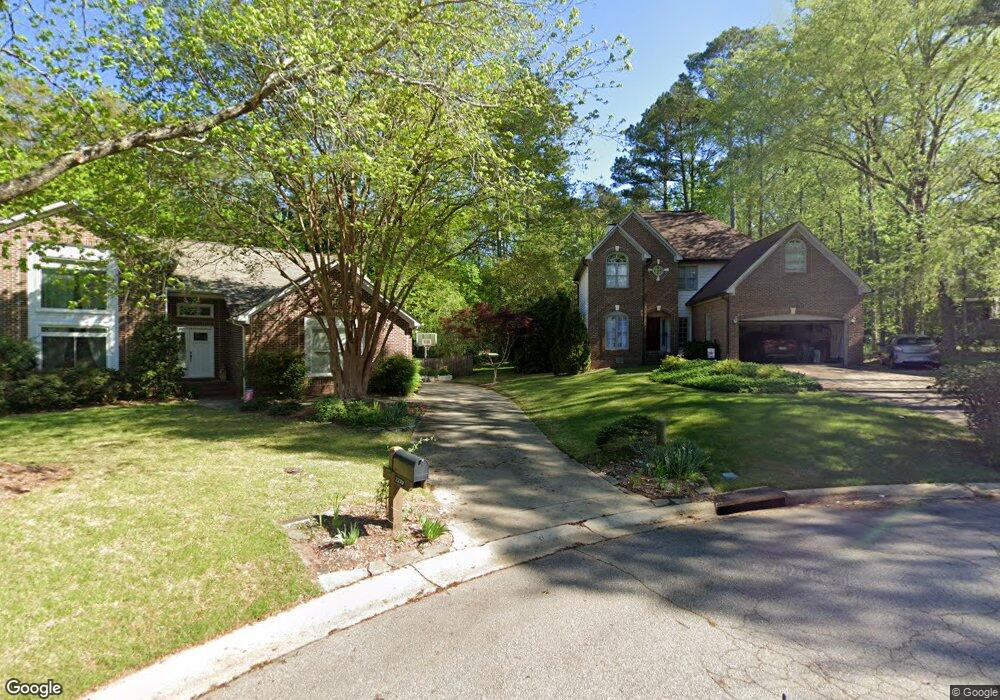
2226 Dungiven Ct Garner, NC 27529
Estimated Value: $394,000 - $456,000
3
Beds
3
Baths
2,182
Sq Ft
$190/Sq Ft
Est. Value
About This Home
This home is located at 2226 Dungiven Ct, Garner, NC 27529 and is currently estimated at $415,060, approximately $190 per square foot. 2226 Dungiven Ct is a home located in Wake County with nearby schools including Vandora Springs Elementary, North Garner Middle, and Garner High.
Ownership History
Date
Name
Owned For
Owner Type
Purchase Details
Closed on
Mar 28, 2011
Sold by
Chandler Karen Lynn
Bought by
Bresolin Stefano and Bresolin Patricia H
Current Estimated Value
Home Financials for this Owner
Home Financials are based on the most recent Mortgage that was taken out on this home.
Original Mortgage
$178,005
Outstanding Balance
$123,665
Interest Rate
4.95%
Mortgage Type
New Conventional
Estimated Equity
$291,395
Purchase Details
Closed on
Jul 22, 2003
Sold by
Marrs Ronald N and Marrs Karen Chandler Jackson
Bought by
Marrs Ronald N
Purchase Details
Closed on
Nov 19, 1997
Sold by
Shern Thomas C
Bought by
Marrs Ronald N and Jackson Karen Chandler
Home Financials for this Owner
Home Financials are based on the most recent Mortgage that was taken out on this home.
Original Mortgage
$156,150
Interest Rate
7.27%
Create a Home Valuation Report for This Property
The Home Valuation Report is an in-depth analysis detailing your home's value as well as a comparison with similar homes in the area
Home Values in the Area
Average Home Value in this Area
Purchase History
| Date | Buyer | Sale Price | Title Company |
|---|---|---|---|
| Bresolin Stefano | $196,000 | Blackacre Title Ins Agency | |
| Marrs Ronald N | -- | -- | |
| Marrs Ronald N | $173,500 | Fidelity National Title Ins |
Source: Public Records
Mortgage History
| Date | Status | Borrower | Loan Amount |
|---|---|---|---|
| Open | Bresolin Stefano | $178,005 | |
| Previous Owner | Marrs Ronald N | $156,150 |
Source: Public Records
Tax History Compared to Growth
Tax History
| Year | Tax Paid | Tax Assessment Tax Assessment Total Assessment is a certain percentage of the fair market value that is determined by local assessors to be the total taxable value of land and additions on the property. | Land | Improvement |
|---|---|---|---|---|
| 2025 | $3,605 | $345,636 | $85,000 | $260,636 |
| 2024 | $3,592 | $345,636 | $85,000 | $260,636 |
| 2023 | $3,421 | $264,845 | $53,000 | $211,845 |
| 2022 | $3,123 | $264,845 | $53,000 | $211,845 |
| 2021 | $2,965 | $264,845 | $53,000 | $211,845 |
| 2020 | $2,926 | $264,845 | $53,000 | $211,845 |
| 2019 | $2,796 | $216,792 | $48,000 | $168,792 |
| 2018 | $2,593 | $216,792 | $48,000 | $168,792 |
| 2017 | $2,508 | $216,792 | $48,000 | $168,792 |
| 2016 | $2,476 | $216,792 | $48,000 | $168,792 |
| 2015 | $2,432 | $213,056 | $44,000 | $169,056 |
| 2014 | $2,317 | $213,056 | $44,000 | $169,056 |
Source: Public Records
Map
Nearby Homes
- 1302 Buffaloe Rd
- 2205 Moon Water Way
- 721 Thompson Rd
- 715 Thompson Rd
- 725 Thompson Rd
- 106 Teak Cir
- 0 Old Stage Rd
- 112 Lager Ln
- 100 Lager Ln
- 122 Holyoke Ct
- 1424 Rollman Farm Rd
- Nassau Cove End Unit Plan at Rollman Farms - Villas
- Nassau Cove Plan at Rollman Farms - Villas
- 1341 Rollman Farm Rd
- 1313 Rollman Farm Rd
- 1336 Rollman Farm Rd
- 1333 Rollman Farm Rd
- 1328 Rollman Farm Rd
- 1317 Rollman Farm Rd
- 442 Waterville St
- 2222 Dungiven Ct
- 2230 Dungiven Ct
- 1712 Misty Meadow Ln
- 2214 Dungiven Ct
- 1716 Misty Meadow Ln
- 2231 Dungiven Ct
- 2229 Dungiven Ct
- 2225 Dungiven Ct
- 2208 Dungiven Ct
- 2200 Dungiven Ct
- 2209 Shady Birch Ln
- 2205 Shady Birch Ln
- 2201 Shady Birch Ln
- 2217 Dungiven Ct
- 1711 Misty Meadow Ln
- 1715 Misty Meadow Ln
- 2213 Dungiven Ct
- 2213 Shady Birch Ln
- 1719 Misty Meadow Ln
- 1705 Misty Meadow Ln