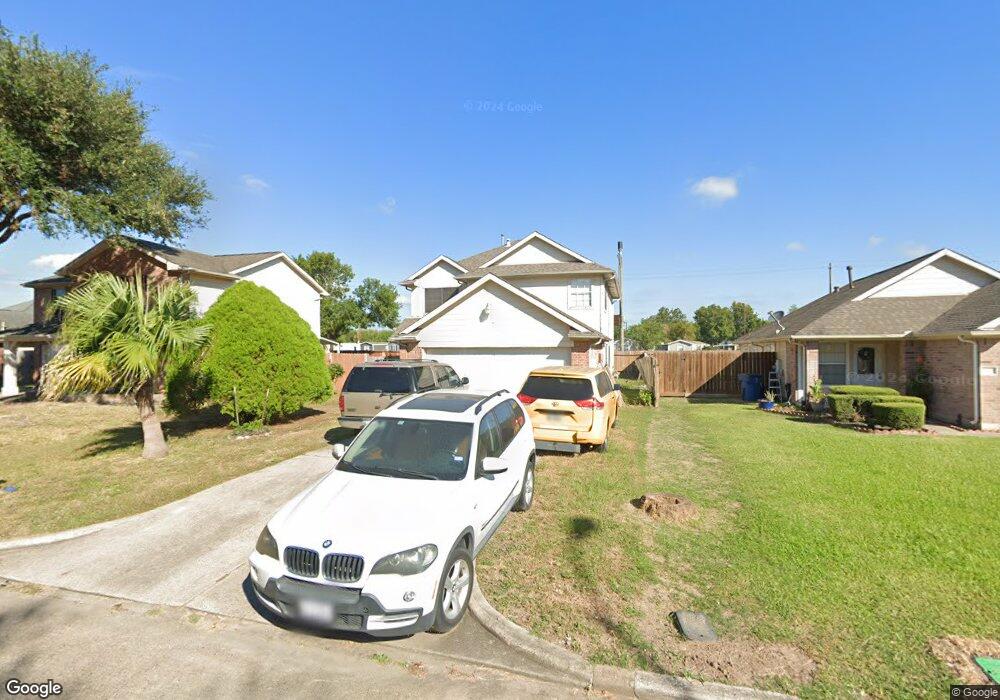
2226 Falling Oaks Rd Houston, TX 77038
North Houston NeighborhoodEstimated Value: $243,000 - $259,000
4
Beds
3
Baths
1,778
Sq Ft
$140/Sq Ft
Est. Value
About This Home
This home is located at 2226 Falling Oaks Rd, Houston, TX 77038 and is currently estimated at $249,654, approximately $140 per square foot. 2226 Falling Oaks Rd is a home located in Harris County with nearby schools including Gloria B. Sammons Elementary School, Stovall School, and Dr. Viola K. Garcia Middle School.
Ownership History
Date
Name
Owned For
Owner Type
Purchase Details
Closed on
Feb 13, 2008
Sold by
Hud
Bought by
Sosa Elodio
Current Estimated Value
Home Financials for this Owner
Home Financials are based on the most recent Mortgage that was taken out on this home.
Original Mortgage
$80,100
Outstanding Balance
$50,551
Interest Rate
6.07%
Mortgage Type
Purchase Money Mortgage
Estimated Equity
$199,103
Purchase Details
Closed on
Jun 13, 2007
Sold by
Wells Fargo Bank Na
Bought by
Hud
Purchase Details
Closed on
Jun 5, 2007
Sold by
Chryar Vermond and Turner Kimberly D
Bought by
Wells Fargo Bank Na
Purchase Details
Closed on
Nov 16, 2004
Sold by
Castorena Arturo and Castorena Griselda
Bought by
Chryar Vermond
Home Financials for this Owner
Home Financials are based on the most recent Mortgage that was taken out on this home.
Original Mortgage
$108,300
Interest Rate
5.87%
Mortgage Type
FHA
Purchase Details
Closed on
May 31, 2001
Sold by
Nuhome Designs Llc
Bought by
Castorena Arturo
Home Financials for this Owner
Home Financials are based on the most recent Mortgage that was taken out on this home.
Original Mortgage
$93,808
Interest Rate
7.16%
Mortgage Type
FHA
Create a Home Valuation Report for This Property
The Home Valuation Report is an in-depth analysis detailing your home's value as well as a comparison with similar homes in the area
Home Values in the Area
Average Home Value in this Area
Purchase History
| Date | Buyer | Sale Price | Title Company |
|---|---|---|---|
| Sosa Elodio | -- | None Available | |
| Hud | -- | None Available | |
| Wells Fargo Bank Na | $109,298 | None Available | |
| Chryar Vermond | -- | Fidelity National Title | |
| Castorena Arturo | -- | Regency Title |
Source: Public Records
Mortgage History
| Date | Status | Borrower | Loan Amount |
|---|---|---|---|
| Open | Sosa Elodio | $80,100 | |
| Previous Owner | Chryar Vermond | $108,300 | |
| Previous Owner | Castorena Arturo | $93,808 |
Source: Public Records
Tax History Compared to Growth
Tax History
| Year | Tax Paid | Tax Assessment Tax Assessment Total Assessment is a certain percentage of the fair market value that is determined by local assessors to be the total taxable value of land and additions on the property. | Land | Improvement |
|---|---|---|---|---|
| 2025 | $6,325 | $222,149 | $33,073 | $189,076 |
| 2024 | $6,325 | $224,693 | $33,073 | $191,620 |
| 2023 | $6,325 | $258,761 | $35,998 | $222,763 |
| 2022 | $5,909 | $197,231 | $35,998 | $161,233 |
| 2021 | $5,348 | $172,780 | $35,998 | $136,782 |
| 2020 | $5,529 | $168,994 | $22,152 | $146,842 |
| 2019 | $5,183 | $151,598 | $22,152 | $129,446 |
| 2018 | $2,039 | $141,981 | $22,152 | $119,829 |
| 2017 | $4,780 | $141,981 | $22,152 | $119,829 |
| 2016 | $4,309 | $136,131 | $22,152 | $113,979 |
| 2015 | $3,253 | $95,226 | $13,845 | $81,381 |
| 2014 | $3,253 | $93,491 | $13,845 | $79,646 |
Source: Public Records
Map
Nearby Homes
- 2203 Chalet Rd
- 2115 Havencrest Dr
- 12718 Sai Baba Dr
- 0 W Mt Houston Rd Unit 90464120
- 00 Fallbrook Dr
- 2614 Lemonwood Ln
- 1327 Fallbrook Dr
- Whitetail Plan at Forestwood
- Kitson Plan at Forestwood
- Pinehollow Plan at Forestwood
- at Forestwood
- 12530 Wild Strawberry Rd
- at Forestwood
- Idlewood Plan at Forestwood
- at Forestwood
- at Forestwood
- Oakridge Plan at Forestwood
- at Forestwood
- 1506 Wilshire Park Dr
- 12518 Pelican Bay Dr
- 2226 Fallen Oaks Rd
- 2222 Falling Oaks Rd
- 2234 Falling Oaks Rd
- 2218 Falling Oaks Rd
- 2238 Falling Oaks Rd
- 2227 Falling Oaks Rd
- 2214 Falling Oaks Rd
- 2223 Falling Oaks Rd
- 2407 Fallen Oaks Rd
- 2319 Fallen Oaks Rd
- 2231 Falling Oaks Rd
- 2219 Falling Oaks Rd
- 2235 Falling Oaks Rd
- 2302 Falling Oaks Rd
- 2210 Falling Oaks Rd
- 2215 Falling Oaks Rd
- 2218 Chalet Rd
- 2211 Falling Oaks Rd
- 2214 Chalet Rd
- 2222 Chalet Rd