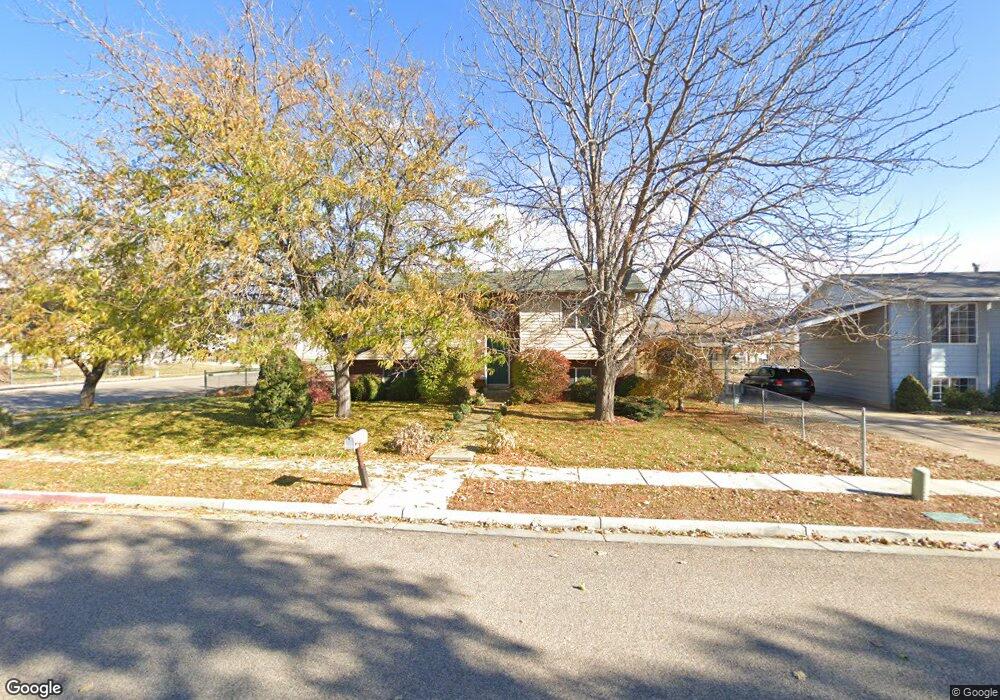
2226 S 450 W Clearfield, UT 84015
Estimated Value: $406,000 - $423,036
4
Beds
2
Baths
2,010
Sq Ft
$206/Sq Ft
Est. Value
About This Home
This home is located at 2226 S 450 W, Clearfield, UT 84015 and is currently estimated at $414,259, approximately $206 per square foot. 2226 S 450 W is a home located in Davis County with nearby schools including Antelope Elementary School, North Davis Junior High School, and Clearfield High School.
Ownership History
Date
Name
Owned For
Owner Type
Purchase Details
Closed on
Feb 10, 2025
Sold by
Lofgreen Seth Nils
Bought by
Castro Manuel and Castro Janeth Marie
Current Estimated Value
Home Financials for this Owner
Home Financials are based on the most recent Mortgage that was taken out on this home.
Original Mortgage
$328,000
Outstanding Balance
$325,766
Interest Rate
6.91%
Mortgage Type
New Conventional
Estimated Equity
$88,493
Purchase Details
Closed on
Jun 24, 2022
Sold by
Kawaguchi Jan J
Bought by
Lofgreen Seth Nils
Home Financials for this Owner
Home Financials are based on the most recent Mortgage that was taken out on this home.
Original Mortgage
$403,750
Interest Rate
5.1%
Mortgage Type
New Conventional
Purchase Details
Closed on
Jul 6, 1999
Sold by
Rencher Jan J
Bought by
Kawaguchi Jan J
Create a Home Valuation Report for This Property
The Home Valuation Report is an in-depth analysis detailing your home's value as well as a comparison with similar homes in the area
Home Values in the Area
Average Home Value in this Area
Purchase History
| Date | Buyer | Sale Price | Title Company |
|---|---|---|---|
| Castro Manuel | -- | None Listed On Document | |
| Lofgreen Seth Nils | -- | Freedom Title | |
| Lofgreen Seth Nils | -- | Stewart Title | |
| Kawaguchi Jan J | -- | -- |
Source: Public Records
Mortgage History
| Date | Status | Borrower | Loan Amount |
|---|---|---|---|
| Open | Castro Manuel | $328,000 | |
| Previous Owner | Lofgreen Seth Nils | $403,750 |
Source: Public Records
Tax History Compared to Growth
Tax History
| Year | Tax Paid | Tax Assessment Tax Assessment Total Assessment is a certain percentage of the fair market value that is determined by local assessors to be the total taxable value of land and additions on the property. | Land | Improvement |
|---|---|---|---|---|
| 2025 | $2,345 | $210,100 | $68,488 | $141,612 |
| 2024 | $2,279 | $205,700 | $65,479 | $140,221 |
| 2023 | $2,088 | $346,000 | $104,807 | $241,193 |
| 2022 | $2,081 | $186,450 | $60,048 | $126,402 |
| 2021 | $397 | $245,000 | $63,704 | $181,296 |
| 2020 | $1,569 | $211,000 | $53,549 | $157,451 |
| 2019 | $1,522 | $202,000 | $56,213 | $145,787 |
| 2018 | $1,369 | $177,000 | $49,895 | $127,105 |
| 2016 | $176 | $79,420 | $19,922 | $59,498 |
| 2015 | $1,114 | $71,830 | $19,922 | $51,908 |
| 2014 | $169 | $68,045 | $19,922 | $48,123 |
| 2013 | -- | $60,451 | $22,470 | $37,981 |
Source: Public Records
Map
Nearby Homes