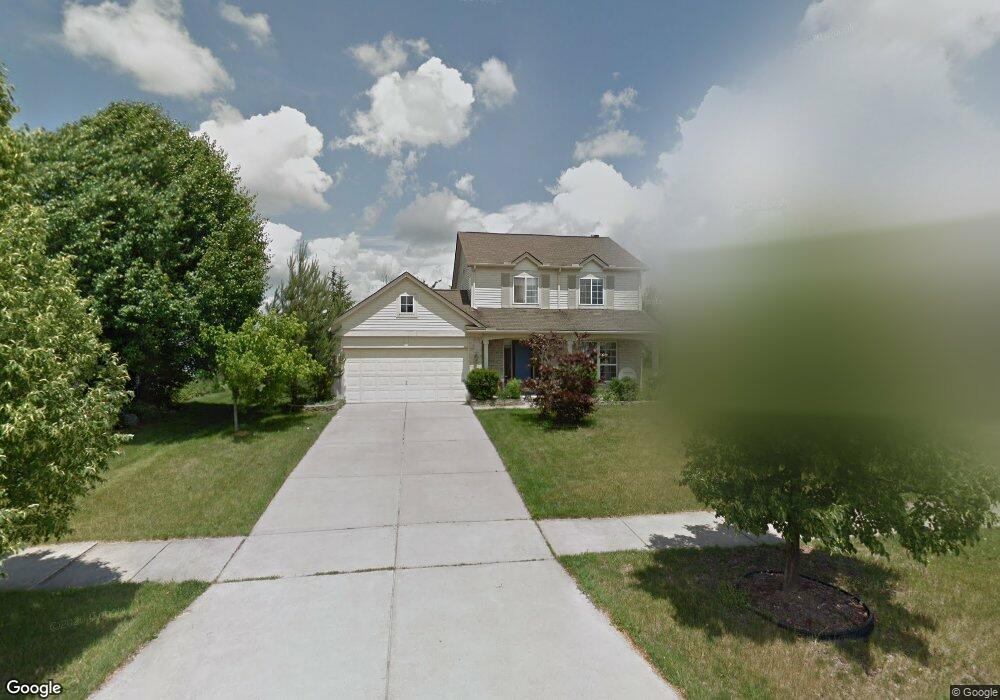
2226 Springridge Dr Unit 121 Ann Arbor, MI 48103
Estimated Value: $426,372 - $577,000
4
Beds
1
Bath
1,482
Sq Ft
$344/Sq Ft
Est. Value
About This Home
This home is located at 2226 Springridge Dr Unit 121, Ann Arbor, MI 48103 and is currently estimated at $509,843, approximately $344 per square foot. 2226 Springridge Dr Unit 121 is a home located in Washtenaw County with nearby schools including Lawton Elementary School, Slauson Middle School, and Pioneer High School.
Ownership History
Date
Name
Owned For
Owner Type
Purchase Details
Closed on
Oct 21, 2005
Sold by
Sung David K and Yim Lisa
Bought by
Wang Kai and Huang Xiuju
Current Estimated Value
Home Financials for this Owner
Home Financials are based on the most recent Mortgage that was taken out on this home.
Original Mortgage
$118,000
Outstanding Balance
$61,599
Interest Rate
5.37%
Mortgage Type
Fannie Mae Freddie Mac
Estimated Equity
$448,244
Purchase Details
Closed on
Aug 18, 2001
Sold by
Beetsch Joel W
Bought by
Sung David R
Purchase Details
Closed on
Oct 1, 1998
Sold by
Harold E Brown Trust
Bought by
Beetsch Joel W and Beetsch Nicole R
Home Financials for this Owner
Home Financials are based on the most recent Mortgage that was taken out on this home.
Original Mortgage
$161,900
Interest Rate
6.98%
Mortgage Type
New Conventional
Purchase Details
Closed on
Jul 16, 1997
Sold by
Boulder Ridge Ii Ltd Ptn
Bought by
Silverman Building Co Inc
Create a Home Valuation Report for This Property
The Home Valuation Report is an in-depth analysis detailing your home's value as well as a comparison with similar homes in the area
Home Values in the Area
Average Home Value in this Area
Purchase History
| Date | Buyer | Sale Price | Title Company |
|---|---|---|---|
| Wang Kai | $260,000 | Fatic | |
| Sung David R | $228,000 | -- | |
| Beetsch Joel W | $176,900 | -- | |
| Silverman Building Co Inc | $42,000 | -- |
Source: Public Records
Mortgage History
| Date | Status | Borrower | Loan Amount |
|---|---|---|---|
| Open | Wang Kai | $118,000 | |
| Previous Owner | Beetsch Joel W | $161,900 |
Source: Public Records
Tax History Compared to Growth
Tax History
| Year | Tax Paid | Tax Assessment Tax Assessment Total Assessment is a certain percentage of the fair market value that is determined by local assessors to be the total taxable value of land and additions on the property. | Land | Improvement |
|---|---|---|---|---|
| 2025 | $3,462 | $175,116 | $0 | $0 |
| 2024 | $3,379 | $170,104 | $0 | $0 |
| 2023 | $3,247 | $170,400 | $0 | $0 |
| 2022 | $4,949 | $164,700 | $0 | $0 |
| 2021 | $4,831 | $158,300 | $0 | $0 |
| 2020 | $4,742 | $156,200 | $0 | $0 |
| 2019 | $4,470 | $141,600 | $141,600 | $0 |
| 2018 | $4,407 | $135,200 | $0 | $0 |
| 2017 | $4,276 | $140,800 | $0 | $0 |
| 2016 | $2,699 | $106,123 | $0 | $0 |
| 2015 | -- | $105,806 | $0 | $0 |
| 2014 | -- | $102,500 | $0 | $0 |
| 2013 | -- | $102,500 | $0 | $0 |
Source: Public Records
Map
Nearby Homes
- 2225 Steeplechase Dr
- 2460 Mershon Dr
- 2050 Delaware Dr
- Lincoln Plan at Townes on the Green
- Willow Plan at Townes on the Green
- 2134 Park Dr Unit 2
- 2130 Park Dr Unit 1
- 3062 Hydrangea Ln Unit 48
- 1740 S Maple Rd Unit 2
- 1720 Avondale Ave
- 1929 Harley Dr
- 1540 Westfield Ave
- 2225 Chaucer Dr
- 526 Galen Cir
- 1998 Bancroft Dr
- 1599 Scio Ridge Rd
- 1623 Long Meadow Trail Unit 59
- 255 Fieldcrest St Unit 218
- 1524 Marian Ave
- 1860 Chicory Ridge
- 2226 Spring Ridge Dr
- 2244 Springridge Dr Unit 122
- 2218 Springridge Dr Unit 120
- 2218 Spring Ridge Dr
- 2244 Spring Ridge Dr
- 2202 Spring Ridge Dr
- 2202 Springridge Dr Unit 119
- 0 Spring Ridge Dr
- 2256 Springridge Dr
- 2660 Aspen Ridge Dr Unit 123
- 2190 Spring Ridge Dr
- 2190 Springridge Dr
- 2663 Aspen Ridge Dr Unit 111
- 2272 Springridge Dr
- 2255 Spring Ridge Dr
- 2255 Springridge Dr Unit 162
- 2676 Aspen Ridge Dr Unit 124
- 2174 Springridge Dr
- 2288 Springridge Dr
- 2275 Springridge Dr