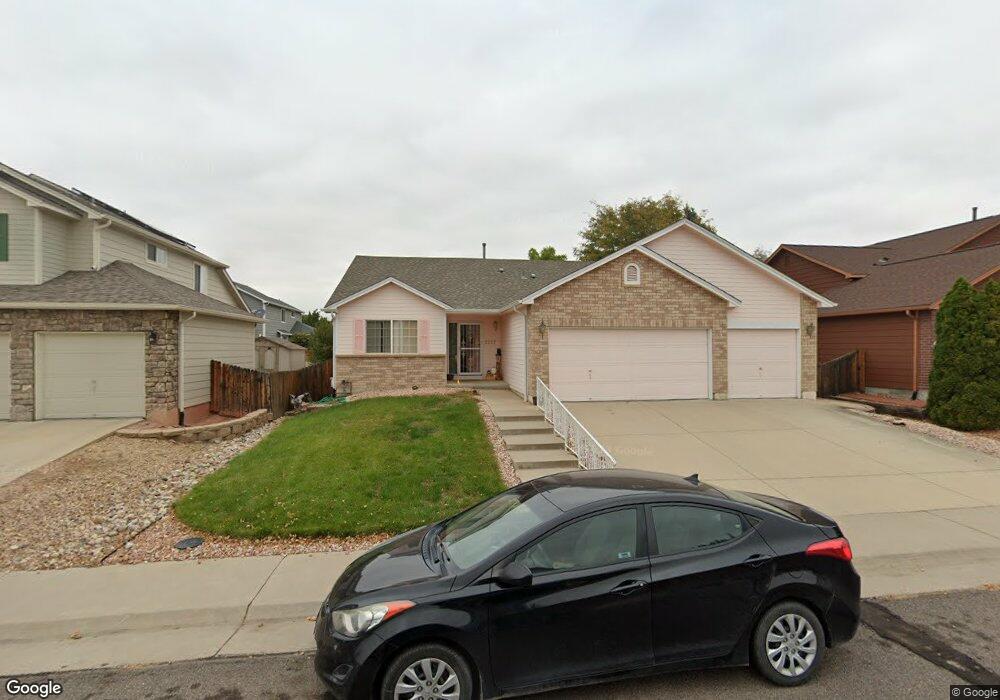
2227 Brantner Place Brighton, CO 80601
Estimated Value: $504,000 - $533,000
3
Beds
2
Baths
2,524
Sq Ft
$205/Sq Ft
Est. Value
About This Home
This home is located at 2227 Brantner Place, Brighton, CO 80601 and is currently estimated at $518,417, approximately $205 per square foot. 2227 Brantner Place is a home located in Adams County with nearby schools including Southeast Elementary School, Vikan Middle School, and Brighton High School.
Ownership History
Date
Name
Owned For
Owner Type
Purchase Details
Closed on
Nov 22, 2019
Sold by
Knoll Cheryl K
Bought by
Jenson Jenna R and Jenson Desryan M
Current Estimated Value
Home Financials for this Owner
Home Financials are based on the most recent Mortgage that was taken out on this home.
Original Mortgage
$358,388
Outstanding Balance
$320,691
Interest Rate
4.5%
Mortgage Type
FHA
Estimated Equity
$197,726
Purchase Details
Closed on
Oct 8, 2019
Sold by
Knoll Cheryl K and Ogrilvie Daniel Dale
Bought by
Kinell Cheryl K
Home Financials for this Owner
Home Financials are based on the most recent Mortgage that was taken out on this home.
Original Mortgage
$358,388
Outstanding Balance
$320,691
Interest Rate
4.5%
Mortgage Type
FHA
Estimated Equity
$197,726
Purchase Details
Closed on
Jul 1, 2019
Sold by
Knoll Cheryl K and Ogilvie Daniel Dle
Bought by
Knoll Cheryl K
Purchase Details
Closed on
Dec 31, 1997
Sold by
Melody Homes Inc
Bought by
Ogilvie Daniel D and Ogilvie Lillian R
Create a Home Valuation Report for This Property
The Home Valuation Report is an in-depth analysis detailing your home's value as well as a comparison with similar homes in the area
Home Values in the Area
Average Home Value in this Area
Purchase History
| Date | Buyer | Sale Price | Title Company |
|---|---|---|---|
| Jenson Jenna R | $365,000 | Land Title Guarantee Co | |
| Kinell Cheryl K | -- | None Available | |
| Knoll Cheryl K | -- | None Available | |
| Ogilvie Daniel D | $154,046 | Land Title |
Source: Public Records
Mortgage History
| Date | Status | Borrower | Loan Amount |
|---|---|---|---|
| Open | Jenson Jenna R | $358,388 |
Source: Public Records
Tax History Compared to Growth
Tax History
| Year | Tax Paid | Tax Assessment Tax Assessment Total Assessment is a certain percentage of the fair market value that is determined by local assessors to be the total taxable value of land and additions on the property. | Land | Improvement |
|---|---|---|---|---|
| 2024 | $3,693 | $31,440 | $6,130 | $25,310 |
| 2023 | $3,671 | $36,800 | $6,430 | $30,370 |
| 2022 | $2,880 | $25,970 | $6,120 | $19,850 |
| 2021 | $2,710 | $25,970 | $6,120 | $19,850 |
| 2020 | $2,592 | $25,940 | $6,290 | $19,650 |
| 2019 | $1,881 | $25,940 | $6,290 | $19,650 |
| 2018 | $1,274 | $19,890 | $6,120 | $13,770 |
| 2017 | $1,276 | $19,890 | $6,120 | $13,770 |
| 2016 | $1,066 | $18,500 | $3,500 | $15,000 |
| 2015 | $1,058 | $10,550 | $2,000 | $8,550 |
| 2014 | $714 | $7,190 | $1,430 | $5,760 |
Source: Public Records
Map
Nearby Homes
- 465 S 24th Ave
- 551 Longhurst Place
- 595 Badger Creek Dr
- 2084 Donna Ct
- 316 S 22nd Ave
- 319 S 25th Ave
- 290 S 22nd Ave
- 321 S 26th Ave
- 2277 Wingler Place
- 253 S 25th Ave
- 2587 E Egbert St
- 2364 Cherry St
- 2608 E Egbert St
- 2618 E Egbert St
- 791 S 21st Ct
- 2617 E Egbert St
- 2411 Cherry Cir
- 406 S 16th Ave
- 2900 Purcell St Unit 6
- 2900 Purcell St Unit I-3
- 2213 Brantner Place
- 2231 Brantner Place
- 432 Badger Creek Dr
- 428 Badger Creek Dr
- 2201 Brantner Place
- 466 Badger Creek Dr
- 426 Badger Creek Dr
- 2243 Brantner Place
- 2286 Brantner Place
- 2272 Brantner Place
- 414 Badger Creek Dr
- 2252 Brantner Place
- 2264 Brantner Place
- 497 S 24th Ave
- 483 Badger Creek Dr
- 495 Badger Creek Dr
- 433 S 24th Ave
- 431 Badger Creek Dr
- 475 Badger Creek Dr
- 443 Badger Creek Dr