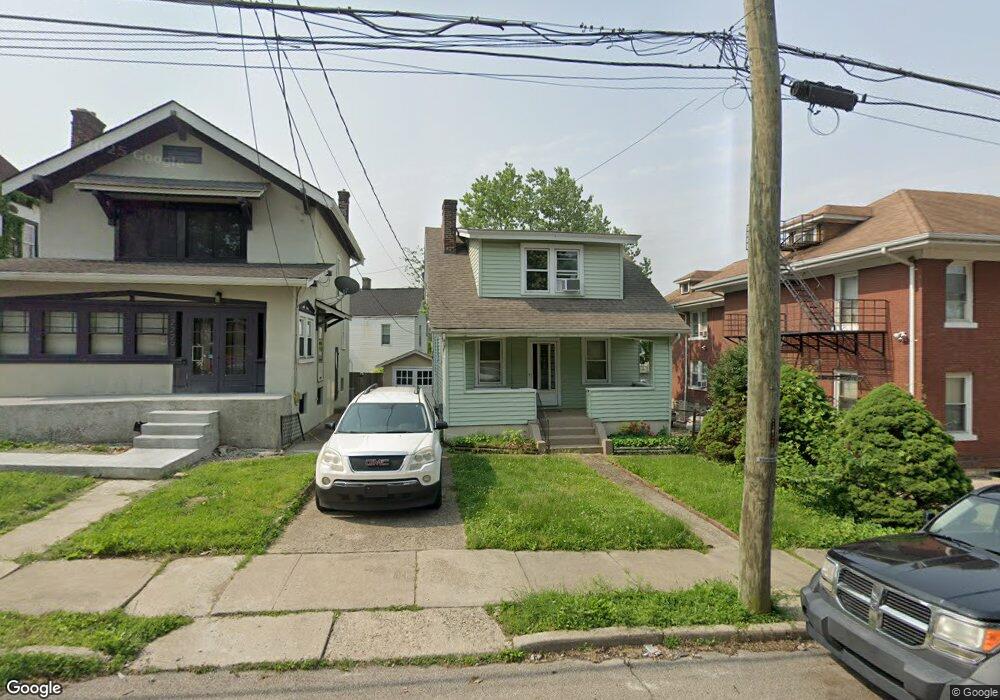
2227 Buxton Ave Cincinnati, OH 45212
Estimated Value: $150,249 - $166,000
2
Beds
1
Bath
1,031
Sq Ft
$156/Sq Ft
Est. Value
About This Home
This home is located at 2227 Buxton Ave, Cincinnati, OH 45212 and is currently estimated at $160,562, approximately $155 per square foot. 2227 Buxton Ave is a home located in Hamilton County with nearby schools including Norwood High School, Cincinnati Hills Christian Middle, and The Summit Country Day School.
Ownership History
Date
Name
Owned For
Owner Type
Purchase Details
Closed on
Sep 2, 2014
Sold by
Samyn Wanda and Samyn Stephen
Bought by
Samyn Stephen
Current Estimated Value
Purchase Details
Closed on
May 17, 1999
Sold by
Samyn Steve M and Samyn Wanda A
Bought by
Samyn Wanda and Samyn Stephen
Purchase Details
Closed on
Nov 18, 1995
Sold by
Gibson Herman E and Gibson Marguerite
Bought by
Samyn Steve M and Samyn Wanda A
Purchase Details
Closed on
Jul 23, 1994
Sold by
Gibson James E and Gibson Cassie M
Bought by
Gibson Herman E and Gibson Marguerite
Home Financials for this Owner
Home Financials are based on the most recent Mortgage that was taken out on this home.
Original Mortgage
$81,000
Interest Rate
8.38%
Create a Home Valuation Report for This Property
The Home Valuation Report is an in-depth analysis detailing your home's value as well as a comparison with similar homes in the area
Home Values in the Area
Average Home Value in this Area
Purchase History
| Date | Buyer | Sale Price | Title Company |
|---|---|---|---|
| Samyn Stephen | -- | Prodigy Title Agency | |
| Samyn Wanda | -- | -- | |
| Samyn Steve M | -- | -- | |
| Gibson Herman E | -- | -- |
Source: Public Records
Mortgage History
| Date | Status | Borrower | Loan Amount |
|---|---|---|---|
| Previous Owner | Gibson Herman E | $81,000 |
Source: Public Records
Tax History
| Year | Tax Paid | Tax Assessment Tax Assessment Total Assessment is a certain percentage of the fair market value that is determined by local assessors to be the total taxable value of land and additions on the property. | Land | Improvement |
|---|---|---|---|---|
| 2025 | $2,019 | $37,769 | $7,301 | $30,468 |
| 2023 | $2,031 | $37,769 | $7,301 | $30,468 |
| 2022 | $1,609 | $25,173 | $5,527 | $19,646 |
| 2021 | $1,589 | $25,173 | $5,527 | $19,646 |
| 2020 | $1,553 | $25,173 | $5,527 | $19,646 |
| 2019 | $1,484 | $22,082 | $4,848 | $17,234 |
| 2018 | $1,485 | $22,082 | $4,848 | $17,234 |
| 2017 | $1,424 | $22,082 | $4,848 | $17,234 |
| 2016 | $1,344 | $19,950 | $4,739 | $15,211 |
| 2015 | $1,184 | $19,950 | $4,739 | $15,211 |
| 2014 | $1,183 | $19,950 | $4,739 | $15,211 |
| 2013 | $1,467 | $25,025 | $4,739 | $20,286 |
Source: Public Records
Map
Nearby Homes
- 2323 Sherwood Ln
- 5044 Wesley Ave
- 5042 Wesley Ave
- 2266 Buxton Ave
- 2134 Ross Ave
- 5206 Montgomery Rd
- 2217 Feldman Ave
- 2229 Feldman Ave
- 2249 Feldman Ave
- 4923 Marion Ave
- 5126 Globe Ave
- 2106 Lawn Ave
- 5123 Globe Ave
- 2310 Norwood Ave
- 5229 Globe Ave
- 5234 Hunter Ave
- 2344 Norwood Ave
- 5121 Rolston Ave
- 2421 Drex Ave
- 5310 Globe Ave
- 2229 Buxton Ave
- 5118 Montgomery Rd
- 2225 Buxton Ave
- 5037 Stewart Park
- 2231 Buxton Ave
- 2220 Buxton Ave
- 5035 Stewart Park
- 5042-50 Montgomery Rd
- 2218 Buxton Ave
- 2224 Buxton Ave
- 5031 Stewart Park
- 2228 Buxton Ave
- 5120 Montgomery Rd
- 2237 Buxton Ave
- 2230 Buxton Ave
- 5116 Montgomery Rd
- 5124 Montgomery Rd
- 5040 Stewart Park
- 2234 Buxton Ave
- 2241 Buxton Ave
Your Personal Tour Guide
Ask me questions while you tour the home.