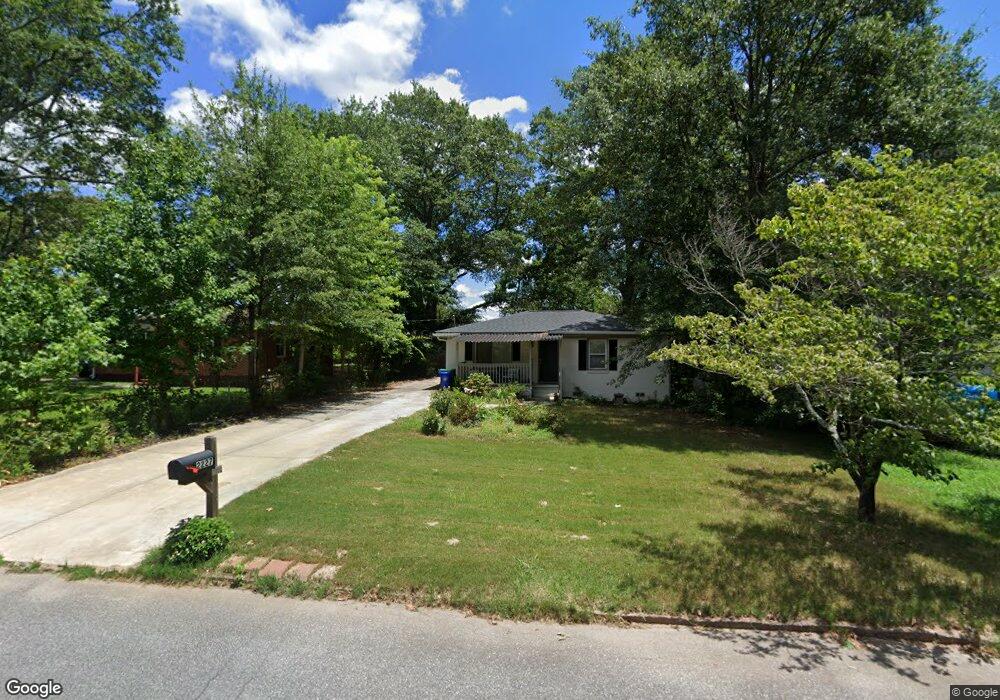
2227 Dillard St Unit 15 Tucker, GA 30084
Estimated Value: $255,044 - $300,000
2
Beds
2
Baths
972
Sq Ft
$284/Sq Ft
Est. Value
About This Home
This home is located at 2227 Dillard St Unit 15, Tucker, GA 30084 and is currently estimated at $276,511, approximately $284 per square foot. 2227 Dillard St Unit 15 is a home located in DeKalb County with nearby schools including Smoke Rise Elementary School, Tucker Middle School, and Tucker High School.
Ownership History
Date
Name
Owned For
Owner Type
Purchase Details
Closed on
Dec 5, 2018
Sold by
Brightline Properties Llc
Bought by
Pasch Anna
Current Estimated Value
Home Financials for this Owner
Home Financials are based on the most recent Mortgage that was taken out on this home.
Original Mortgage
$151,200
Outstanding Balance
$133,219
Interest Rate
4.9%
Mortgage Type
New Conventional
Estimated Equity
$143,292
Purchase Details
Closed on
Nov 16, 2012
Sold by
Gunawan Arif
Bought by
Brightline Properties Llc
Purchase Details
Closed on
May 24, 2012
Sold by
Federal Home Loan Mortgage Corporation
Bought by
Gunawan Arif
Purchase Details
Closed on
Feb 7, 2012
Sold by
Bank Of America Na
Bought by
Federal Home Loan Mortgage Corporation
Purchase Details
Closed on
Dec 31, 2004
Sold by
Fountain-Telfair Edwiner
Bought by
Fountain-Telfair Edwiner and Telfair William
Create a Home Valuation Report for This Property
The Home Valuation Report is an in-depth analysis detailing your home's value as well as a comparison with similar homes in the area
Home Values in the Area
Average Home Value in this Area
Purchase History
| Date | Buyer | Sale Price | Title Company |
|---|---|---|---|
| Pasch Anna | $168,000 | -- | |
| Brightline Properties Llc | -- | -- | |
| Gunawan Arif | $30,000 | -- | |
| Federal Home Loan Mortgage Corporation | $74,669 | -- | |
| Bank Of America Na | $74,669 | -- | |
| Fountain-Telfair Edwiner | -- | -- |
Source: Public Records
Mortgage History
| Date | Status | Borrower | Loan Amount |
|---|---|---|---|
| Open | Pasch Anna | $151,200 |
Source: Public Records
Tax History Compared to Growth
Tax History
| Year | Tax Paid | Tax Assessment Tax Assessment Total Assessment is a certain percentage of the fair market value that is determined by local assessors to be the total taxable value of land and additions on the property. | Land | Improvement |
|---|---|---|---|---|
| 2025 | $3,329 | $117,440 | $36,000 | $81,440 |
| 2024 | $3,156 | $108,000 | $36,000 | $72,000 |
| 2023 | $3,156 | $108,320 | $36,000 | $72,320 |
| 2022 | $2,517 | $84,440 | $18,000 | $66,440 |
| 2021 | $2,242 | $71,200 | $18,000 | $53,200 |
| 2020 | $1,968 | $60,200 | $8,320 | $51,880 |
| 2019 | $1,867 | $56,800 | $8,320 | $48,480 |
| 2018 | $1,744 | $45,600 | $8,320 | $37,280 |
| 2017 | $1,540 | $27,280 | $8,320 | $18,960 |
| 2016 | $1,543 | $27,280 | $8,320 | $18,960 |
| 2014 | $1,158 | $18,120 | $8,320 | $9,800 |
Source: Public Records
Map
Nearby Homes
- 4365 Cowan Rd
- 2225 Dillard Crossing
- 6105 Wayburn St
- 2451 Ivey Crest Cir
- 4360 Sasanqua Ct Unit 2
- 4345 Sasanqua Ct
- 4339 Sasanqua Ct
- 4217 Theresa Ct
- 2215 Nena Way Unit 20
- 2219 Nena Way Unit 22
- 4257 Freight St
- 2544 Lehaven Dr
- 2161 Carson Valley Dr
- 4526 Sims Ct
- 2154 Brockett Rd
- 2520 Summeroak Dr
- 4383 Idlewood Ln
- 4180 Hannah Rd
- 4312 Idlewood Ln
- 4409 Idlewood Ln
- 2227 Dillard St
- 2223 Dillard St
- 2233 Dillard St
- 2217 Dillard St
- 2213 Dillard St
- 2226 Dillard St
- 2222 Dillard St
- 2218 Dillard St
- 2209 Dillard St
- 2214 Rosser Terrace
- 2214 Dillard St
- 2203 Dillard St
- 2206 Rosser Terrace
- 2210 Dillard St
- 4419 Cowan Rd
- 2199 Dillard St
- 2200 Rosser Terrace
- 2204 Dillard St
- 4445 Hugh Howell Rd
- 4405 Cowan Rd Unit A