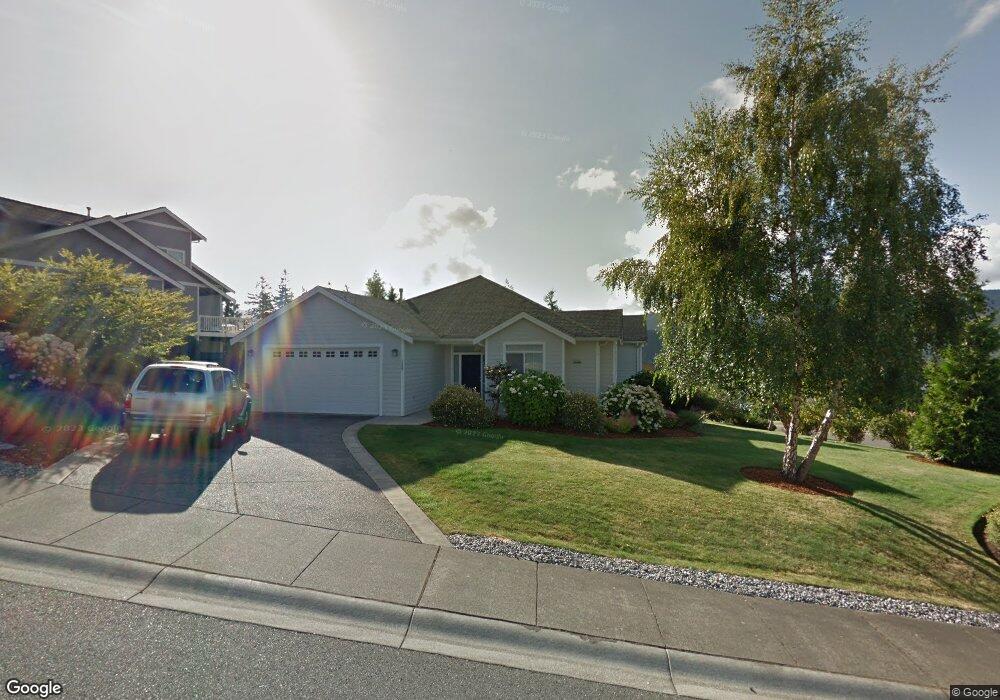
2227 Hawk Way Bellingham, WA 98229
Samish NeighborhoodEstimated Value: $960,604 - $1,295,000
3
Beds
2
Baths
2,112
Sq Ft
$522/Sq Ft
Est. Value
About This Home
This home is located at 2227 Hawk Way, Bellingham, WA 98229 and is currently estimated at $1,102,651, approximately $522 per square foot. 2227 Hawk Way is a home located in Whatcom County with nearby schools including Wade King Elementary School, Fairhaven Middle School, and Sehome High School.
Ownership History
Date
Name
Owned For
Owner Type
Purchase Details
Closed on
Feb 18, 2000
Sold by
Scherer Kurt W and Scherer Lydia L
Bought by
Alarid Greg and Castillo Janice
Current Estimated Value
Home Financials for this Owner
Home Financials are based on the most recent Mortgage that was taken out on this home.
Original Mortgage
$252,700
Outstanding Balance
$83,414
Interest Rate
8.14%
Estimated Equity
$1,019,237
Purchase Details
Closed on
Sep 9, 1999
Sold by
The Barbo Family Ltd Partnership
Bought by
Scherer Kurt W and Scherer Lydia L
Home Financials for this Owner
Home Financials are based on the most recent Mortgage that was taken out on this home.
Original Mortgage
$212,500
Interest Rate
7.66%
Create a Home Valuation Report for This Property
The Home Valuation Report is an in-depth analysis detailing your home's value as well as a comparison with similar homes in the area
Home Values in the Area
Average Home Value in this Area
Purchase History
| Date | Buyer | Sale Price | Title Company |
|---|---|---|---|
| Alarid Greg | $266,000 | Chicago Title Insurance Co | |
| Scherer Kurt W | $74,000 | Chicago Title Insurance Co |
Source: Public Records
Mortgage History
| Date | Status | Borrower | Loan Amount |
|---|---|---|---|
| Open | Alarid Greg | $252,700 | |
| Previous Owner | Scherer Kurt W | $212,500 |
Source: Public Records
Tax History Compared to Growth
Tax History
| Year | Tax Paid | Tax Assessment Tax Assessment Total Assessment is a certain percentage of the fair market value that is determined by local assessors to be the total taxable value of land and additions on the property. | Land | Improvement |
|---|---|---|---|---|
| 2024 | $7,476 | $927,727 | $380,115 | $547,612 |
| 2023 | $7,476 | $960,896 | $393,705 | $567,191 |
| 2022 | $6,126 | $817,788 | $335,070 | $482,718 |
| 2021 | $5,694 | $659,524 | $270,225 | $389,299 |
| 2020 | $5,592 | $578,526 | $237,038 | $341,488 |
| 2019 | $5,394 | $549,146 | $225,000 | $324,146 |
| 2018 | $5,600 | $531,121 | $217,217 | $313,904 |
| 2017 | $4,934 | $471,445 | $192,808 | $278,637 |
| 2016 | $4,495 | $434,139 | $177,408 | $256,731 |
| 2015 | $4,425 | $411,756 | $168,168 | $243,588 |
| 2014 | -- | $392,138 | $160,160 | $231,978 |
| 2013 | -- | $373,054 | $154,000 | $219,054 |
Source: Public Records
Map
Nearby Homes
- 2010 Samish Crest Way
- 4203 Harrison St
- 2500 Samish Way Unit 50
- 2500 Samish Way Unit 13
- 2604 S 42nd St
- 2608 S 42nd St
- 2600 42nd
- 1912 S Colby Ct
- 1800 40th Place
- 4915 Samish Way Unit 60
- 4915 Samish Way Unit 66
- 955 Colony Ct
- 1615 Samish Way
- 921 Whitewater Dr
- 750 Samish Way
- 3605 Mill Ave
- 2174 Yew Street Rd Unit 22
- 4949 Samish Way Unit 6
- 3104 Wilson Ave
- 1758 Old Samish Rd
- 2223 Hawk Way
- 4605 Parkhurst Dr
- 2228 Hawk Way
- 4600 Parkhurst Dr
- 2219 Hawk Way
- 4601 Raptor Ln
- 4606 Parkhurst Dr
- 4615 Parkhurst Dr
- 4522 Parkhurst Dr
- 4519 Parkhurst Dr
- 2305 Hawk Way
- 2215 Hawk Way
- 4614 Parkhurst Dr
- 4605 Raptor Ln
- 4620 Raptor Ln
- 2304 Hawk Way
- 4518 Parkhurst Dr
- 4619 Parkhurst Dr
- 4515 Parkhurst Dr
- 2211 Hawk Way