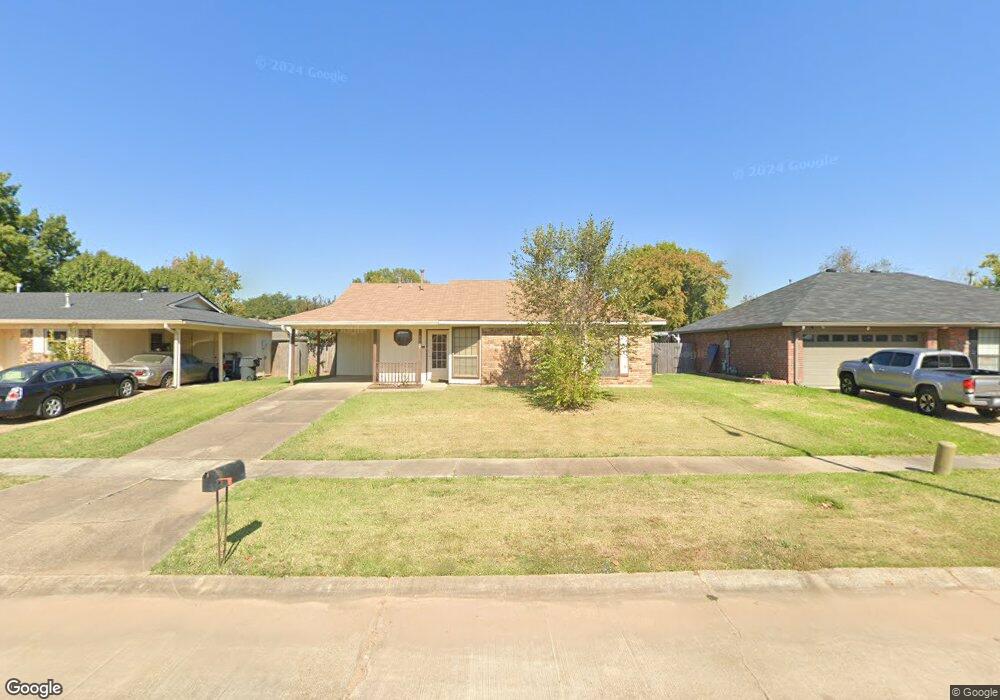
2227 Kirby Smith Dr Bossier City, LA 71112
South Bossier NeighborhoodEstimated Value: $152,000 - $162,000
3
Beds
2
Baths
1,074
Sq Ft
$147/Sq Ft
Est. Value
About This Home
This home is located at 2227 Kirby Smith Dr, Bossier City, LA 71112 and is currently estimated at $157,484, approximately $146 per square foot. 2227 Kirby Smith Dr is a home located in Bossier Parish with nearby schools including Sun City Elementary School, Curtis Elementary School, and Elm Grove Middle School.
Ownership History
Date
Name
Owned For
Owner Type
Purchase Details
Closed on
Sep 23, 2025
Sold by
Boardwalk Investors
Bought by
Cyclone Assets
Current Estimated Value
Purchase Details
Closed on
Jun 28, 2022
Sold by
Hammell Coleman Linda Sue
Bought by
State Of Louisiana
Purchase Details
Closed on
Jun 26, 2020
Sold by
Coleman Linda
Bought by
Nebraska Alliance Realty
Purchase Details
Closed on
Jun 27, 2018
Sold by
Coleman Linda S
Bought by
Blackstone Holdings Llc
Create a Home Valuation Report for This Property
The Home Valuation Report is an in-depth analysis detailing your home's value as well as a comparison with similar homes in the area
Home Values in the Area
Average Home Value in this Area
Purchase History
| Date | Buyer | Sale Price | Title Company |
|---|---|---|---|
| Cyclone Assets | -- | None Listed On Document | |
| State Of Louisiana | $484 | None Listed On Document | |
| Nebraska Alliance Realty | $973 | None Available | |
| Blackstone Holdings Llc | -- | -- | |
| Eastern Props | $682 | -- |
Source: Public Records
Tax History Compared to Growth
Tax History
| Year | Tax Paid | Tax Assessment Tax Assessment Total Assessment is a certain percentage of the fair market value that is determined by local assessors to be the total taxable value of land and additions on the property. | Land | Improvement |
|---|---|---|---|---|
| 2024 | $1,432 | $11,798 | $2,450 | $9,348 |
| 2023 | $1,341 | $10,287 | $2,450 | $7,837 |
| 2022 | $1,103 | $10,287 | $2,450 | $7,837 |
| 2021 | $232 | $10,287 | $2,450 | $7,837 |
| 2020 | $1,102 | $10,287 | $2,450 | $7,837 |
| 2019 | $1,115 | $10,260 | $2,400 | $7,860 |
| 2018 | $1,115 | $10,260 | $2,400 | $7,860 |
| 2017 | $539 | $10,260 | $2,400 | $7,860 |
| 2016 | $531 | $10,260 | $2,400 | $7,860 |
| 2015 | $222 | $9,770 | $2,400 | $7,370 |
| 2014 | $222 | $9,770 | $2,400 | $7,370 |
Source: Public Records
Map
Nearby Homes
- 4808 General Scott Place
- 4717 General Ewell Dr
- 4932 General Ashley Dr
- 4931 General Rusk Dr
- 501 Falling Water Cir
- 2118 General Forrest Dr
- 522 Antietam Dr
- 1931 Alfred Ln
- 1957 Rossie Lee Dr
- 1943 Rossie Lee Dr
- 1945 Rossie Lee Dr
- 000 Rossie Lee Dr
- 5000 Longstreet Place
- 349 Antietam Dr
- 413 Antietam Dr
- 2002 General Jackson Place
- 402 Antietam Dr
- 1911 General Jackson Place
- 466 Jordan Dr
- 367 Avondale Ln
- 2225 Kirby Smith Dr
- 2229 Kirby Smith Dr
- 2221 General York Cir
- 2223 Kirby Smith Dr
- 4826 General Ewell Dr
- 2218 Kirby Smith Dr
- 4824 General Ewell Dr
- 4828 General Ewell Dr
- 4822 General Ewell Dr
- 2220 Kirby Smith Dr
- 2216 Kirby Smith Dr
- 2219 General York Cir
- 2222 Kirby Smith Dr
- 4820 General Ewell Dr
- 2224 Kirby Smith Dr
- 2209 Kirby Smith Dr
- 2212 Kirby Smith Dr
- 4818 General Ewell Dr
- 4900 General Ewell Dr
- 2210 Kirby Smith Dr