Estimated Value: $397,735 - $486,000
4
Beds
2
Baths
1,792
Sq Ft
$245/Sq Ft
Est. Value
About This Home
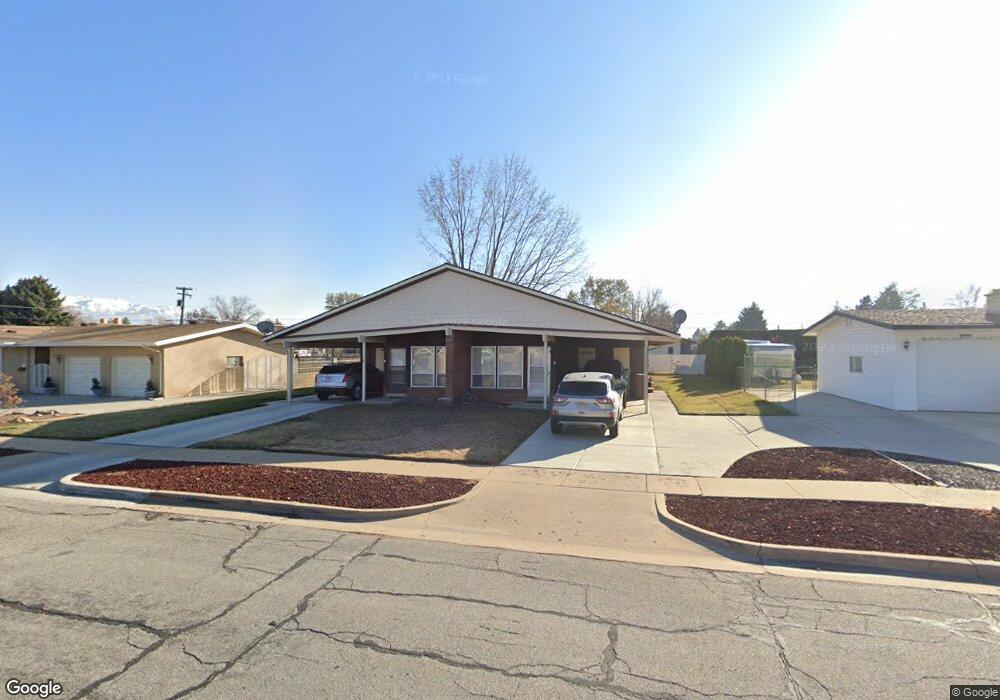
This home is located at 2227 W 4300 S, Roy, UT 84067 and is currently estimated at $439,684, approximately $245 per square foot. 2227 W 4300 S is a home with nearby schools including North Park School, Sand Ridge Junior High School, and Roy High School.
Ownership History
Date
Name
Owned For
Owner Type
Purchase Details
Closed on
Nov 25, 2020
Sold by
Child Brian P and Child Jacob T
Bought by
Bjc Family Llc
Current Estimated Value
Purchase Details
Closed on
Feb 22, 2011
Sold by
Bjc Family Llc
Bought by
Child Brian P and Child Jacob T
Purchase Details
Closed on
Oct 7, 2007
Sold by
Anna Devries Thompsen Revocable Trust and Thompsen Dale
Bought by
Bjc Family Llc
Purchase Details
Closed on
Feb 23, 2007
Sold by
Thompsen Dale and Gibson Deann
Bought by
Bjc Family Llc
Create a Home Valuation Report for This Property
The Home Valuation Report is an in-depth analysis detailing your home's value as well as a comparison with similar homes in the area
Home Values in the Area
Average Home Value in this Area
Purchase History
| Date | Buyer | Sale Price | Title Company |
|---|---|---|---|
| Bjc Family Llc | -- | None Available | |
| Child Brian P | -- | First American Title | |
| Bjc Family Llc | -- | First American Title | |
| Bjc Family Llc | -- | First American Title | |
| Bjc Family Llc | -- | None Available | |
| Bjc Family Llc | -- | None Available |
Source: Public Records
Tax History
| Year | Tax Paid | Tax Assessment Tax Assessment Total Assessment is a certain percentage of the fair market value that is determined by local assessors to be the total taxable value of land and additions on the property. | Land | Improvement |
|---|---|---|---|---|
| 2025 | $2,285 | $356,250 | $100,000 | $256,250 |
| 2024 | $2,229 | $350,000 | $100,000 | $250,000 |
| 2023 | $2,526 | $405,000 | $74,000 | $331,000 |
| 2022 | $2,545 | $420,000 | $50,000 | $370,000 |
| 2021 | $1,949 | $288,000 | $50,000 | $238,000 |
| 2020 | $1,848 | $251,000 | $69,945 | $181,055 |
| 2019 | $1,694 | $233,800 | $39,986 | $193,814 |
| 2018 | $1,472 | $173,212 | $36,988 | $136,224 |
| 2017 | $1,307 | $142,162 | $37,005 | $105,157 |
| 2016 | $1,214 | $70,463 | $18,150 | $52,313 |
| 2015 | $1,154 | $68,572 | $18,150 | $50,422 |
| 2014 | $1,195 | $70,786 | $18,150 | $52,636 |
Source: Public Records
Map
Nearby Homes
- 4328 S 2175 W
- 4248 S 2400 W
- 4220 S 2075 W
- 2015 W 4225 S
- 4061 S 2175 W
- 4047 S 2175 W
- 2038 W 4600 S
- 1959 3985 St S Unit 2
- 4536 S 1900 W Unit 12
- 3923 S 1975 W Unit 15
- 4642 S 1900 W Unit 41
- 2240 W 3875 S
- 4297 Westlake Dr
- 1940 W 3920 S
- 1910 W 3920 S
- 3860 Midland Dr Unit C10
- 3860 Midland Dr Unit C39
- 3860 Midland Dr Unit A18
- 3860 Midland Dr Unit B32
- 3860 Midland Dr Unit C62
Your Personal Tour Guide
Ask me questions while you tour the home.