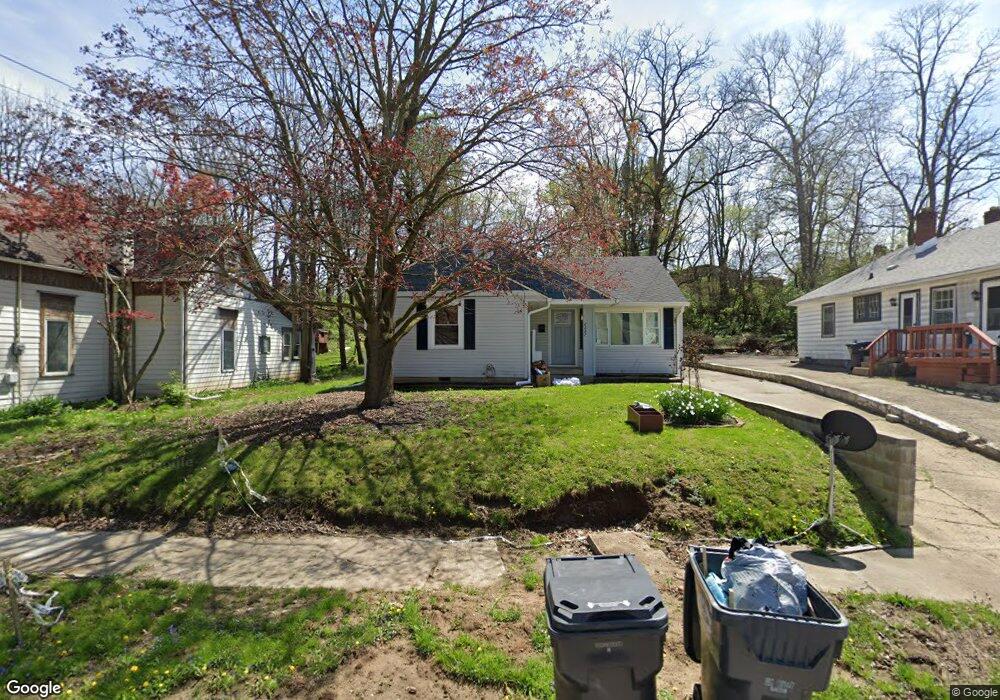
2227 W 9th St Anderson, IN 46016
Estimated Value: $65,000 - $131,000
3
Beds
1
Bath
1,133
Sq Ft
$91/Sq Ft
Est. Value
About This Home
This home is located at 2227 W 9th St, Anderson, IN 46016 and is currently estimated at $102,976, approximately $90 per square foot. 2227 W 9th St is a home located in Madison County with nearby schools including Edgewood Elementary School, Highland Middle School, and Anderson High School.
Ownership History
Date
Name
Owned For
Owner Type
Purchase Details
Closed on
Dec 6, 2023
Sold by
Indianapolis Real Estate Investments Llc
Bought by
Ruhl Investment Group Llc
Current Estimated Value
Home Financials for this Owner
Home Financials are based on the most recent Mortgage that was taken out on this home.
Original Mortgage
$2,800,000
Outstanding Balance
$1,929,418
Interest Rate
7.03%
Mortgage Type
Credit Line Revolving
Estimated Equity
-$1,826,442
Purchase Details
Closed on
Jul 14, 2023
Sold by
Allen Lori E
Bought by
Indianapolis Real Estate Investments Llc
Home Financials for this Owner
Home Financials are based on the most recent Mortgage that was taken out on this home.
Original Mortgage
$98,514
Interest Rate
6.79%
Mortgage Type
New Conventional
Purchase Details
Closed on
Oct 18, 2016
Sold by
Pnc Bank Na
Bought by
Allen Warren M and Allen Lori E
Purchase Details
Closed on
Mar 24, 2016
Sold by
Madison County Sheriff
Bought by
Pnc Bank Na
Create a Home Valuation Report for This Property
The Home Valuation Report is an in-depth analysis detailing your home's value as well as a comparison with similar homes in the area
Home Values in the Area
Average Home Value in this Area
Purchase History
| Date | Buyer | Sale Price | Title Company |
|---|---|---|---|
| Ruhl Investment Group Llc | -- | None Listed On Document | |
| Indianapolis Real Estate Investments Llc | $49,000 | Eagle Land Title | |
| Allen Warren M | -- | -- | |
| Pnc Bank Na | $16,200 | -- |
Source: Public Records
Mortgage History
| Date | Status | Borrower | Loan Amount |
|---|---|---|---|
| Open | Ruhl Investment Group Llc | $2,800,000 | |
| Previous Owner | Indianapolis Real Estate Investments Llc | $98,514 |
Source: Public Records
Tax History Compared to Growth
Tax History
| Year | Tax Paid | Tax Assessment Tax Assessment Total Assessment is a certain percentage of the fair market value that is determined by local assessors to be the total taxable value of land and additions on the property. | Land | Improvement |
|---|---|---|---|---|
| 2024 | $1,316 | $59,200 | $8,000 | $51,200 |
| 2023 | $1,212 | $54,200 | $7,600 | $46,600 |
| 2022 | $1,213 | $54,200 | $7,100 | $47,100 |
| 2021 | $1,121 | $49,800 | $7,100 | $42,700 |
| 2020 | $1,069 | $47,300 | $6,700 | $40,600 |
| 2019 | $1,043 | $46,100 | $6,700 | $39,400 |
| 2018 | $979 | $42,400 | $6,700 | $35,700 |
| 2017 | $840 | $42,000 | $6,700 | $35,300 |
| 2016 | $840 | $42,000 | $6,700 | $35,300 |
| 2014 | $724 | $36,200 | $6,100 | $30,100 |
| 2013 | $724 | $36,200 | $6,100 | $30,100 |
Source: Public Records
Map
Nearby Homes
- 910 Raible Ave
- 2205 Nichol Ave
- 1222 Irving Way
- 1830 Nichol Ave
- 1808 Nichol Ave
- 1411 Halford St
- 2308 W 16th St
- 2104 W 16th St
- 1612 Hst W 10th St
- 1616 Reverend J T Menifee St
- 1507 W 7th St
- 1425 W 9th St
- 1818 Dewey St
- 2011 W 18th St
- 1827 Fulton St
- 1421 W 5th St
- 1509 W 4th St
- 710 Henry St
- 1512 W 3rd St
- 1404 W 5th St