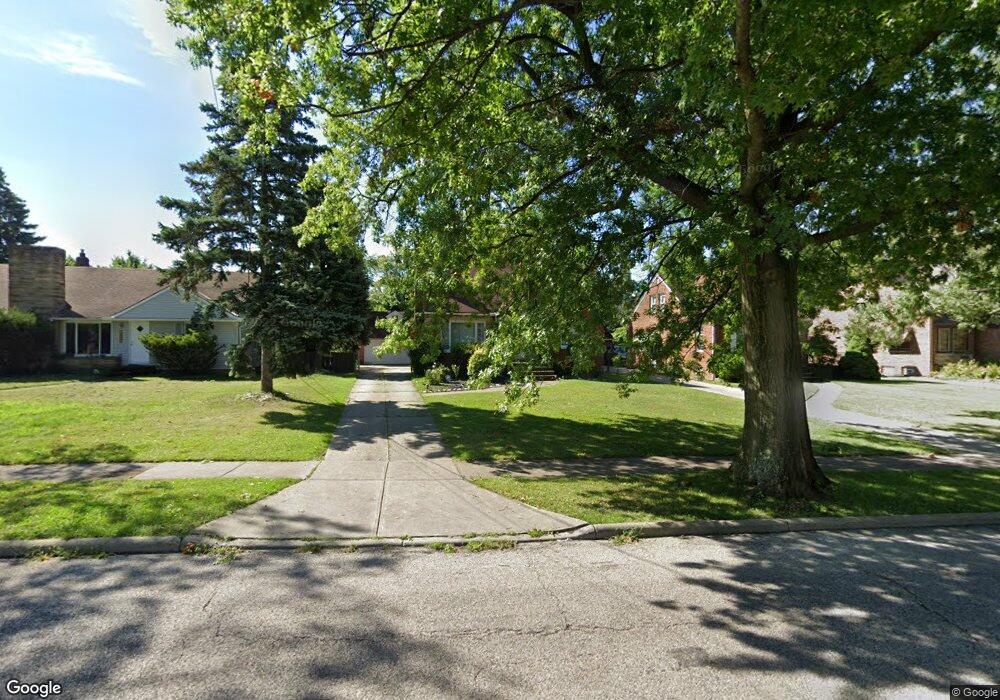
22270 Chardon Rd Euclid, OH 44117
Estimated Value: $180,000 - $229,000
3
Beds
2
Baths
1,554
Sq Ft
$127/Sq Ft
Est. Value
About This Home
This home is located at 22270 Chardon Rd, Euclid, OH 44117 and is currently estimated at $197,276, approximately $126 per square foot. 22270 Chardon Rd is a home located in Cuyahoga County with nearby schools including Thomas Jefferson Elementary School, Euclid Middle School, and Euclid High School.
Ownership History
Date
Name
Owned For
Owner Type
Purchase Details
Closed on
Dec 24, 2014
Sold by
Mckay Joseph
Bought by
Mckay Kaller W and Mckay Joseph F
Current Estimated Value
Purchase Details
Closed on
Sep 19, 2005
Sold by
Mckay Joseph
Bought by
Mckay Joseph and Mckay Kaller
Purchase Details
Closed on
Mar 1, 2001
Sold by
Josip Bucar and Walter Barbara
Bought by
Mckay Joseph
Home Financials for this Owner
Home Financials are based on the most recent Mortgage that was taken out on this home.
Original Mortgage
$126,004
Outstanding Balance
$46,019
Interest Rate
7.06%
Mortgage Type
FHA
Estimated Equity
$151,257
Purchase Details
Closed on
Jan 1, 1975
Bought by
Bucar Josip and Bucar Barbara
Create a Home Valuation Report for This Property
The Home Valuation Report is an in-depth analysis detailing your home's value as well as a comparison with similar homes in the area
Home Values in the Area
Average Home Value in this Area
Purchase History
| Date | Buyer | Sale Price | Title Company |
|---|---|---|---|
| Mckay Kaller W | -- | None Available | |
| Mckay Joseph | -- | -- | |
| Mckay Joseph | $127,000 | Progressive Land Title | |
| Bucar Josip | -- | -- |
Source: Public Records
Mortgage History
| Date | Status | Borrower | Loan Amount |
|---|---|---|---|
| Open | Mckay Joseph | $126,004 |
Source: Public Records
Tax History Compared to Growth
Tax History
| Year | Tax Paid | Tax Assessment Tax Assessment Total Assessment is a certain percentage of the fair market value that is determined by local assessors to be the total taxable value of land and additions on the property. | Land | Improvement |
|---|---|---|---|---|
| 2024 | $3,360 | $49,175 | $10,990 | $38,185 |
| 2023 | $2,046 | $23,180 | $9,070 | $14,110 |
| 2022 | $2,000 | $23,170 | $9,070 | $14,110 |
| 2021 | $2,224 | $23,170 | $9,070 | $14,110 |
| 2020 | $2,115 | $19,950 | $7,810 | $12,150 |
| 2019 | $2,299 | $70,000 | $22,300 | $47,700 |
| 2018 | $2,876 | $24,500 | $7,810 | $16,700 |
| 2017 | $3,705 | $33,220 | $6,620 | $26,600 |
| 2016 | $3,713 | $33,220 | $6,620 | $26,600 |
| 2015 | $3,377 | $33,220 | $6,620 | $26,600 |
| 2014 | $3,377 | $33,220 | $6,620 | $26,600 |
Source: Public Records
Map
Nearby Homes
- 22261 Chardon Rd
- 2075 E 226th St
- 21950 Euclid Ave
- 1775 E 228th St
- 1554 E 221st St
- 1545 E 214th St
- 1774 E 236th St
- 1696 E 236th St
- 22601 Harms Rd
- 1765 E 238th St
- 23751 Glenbrook Blvd
- 1860 Glenridge Rd
- 24105 Chardon Rd
- 23795 Greenwood Rd
- 1556 Dille Rd
- 2111 Aberdeen Dr
- 24 Washington Square
- 1721 Grand Blvd
- 2093 Newcome St
- 363 Balmoral Dr
- 22250 Chardon Rd
- 22350 Chardon Rd
- 22200 Chardon Rd
- 1970 E 224th St
- 22180 Chardon Rd
- 1974 E 224th St
- 22231 Chardon Rd
- 1971 E 221st St
- 22150 Chardon Rd
- 22400 Chardon Rd
- 1976 E 224th St
- 1975 E 221st St
- 22281 Chardon Rd
- 22201 Chardon Rd
- 22375 Chardon Rd
- 22450 Chardon Rd
- 1977 E 221st St
- 1980 E 224th St
- 22181 Chardon Rd
- 1971 E 224th St