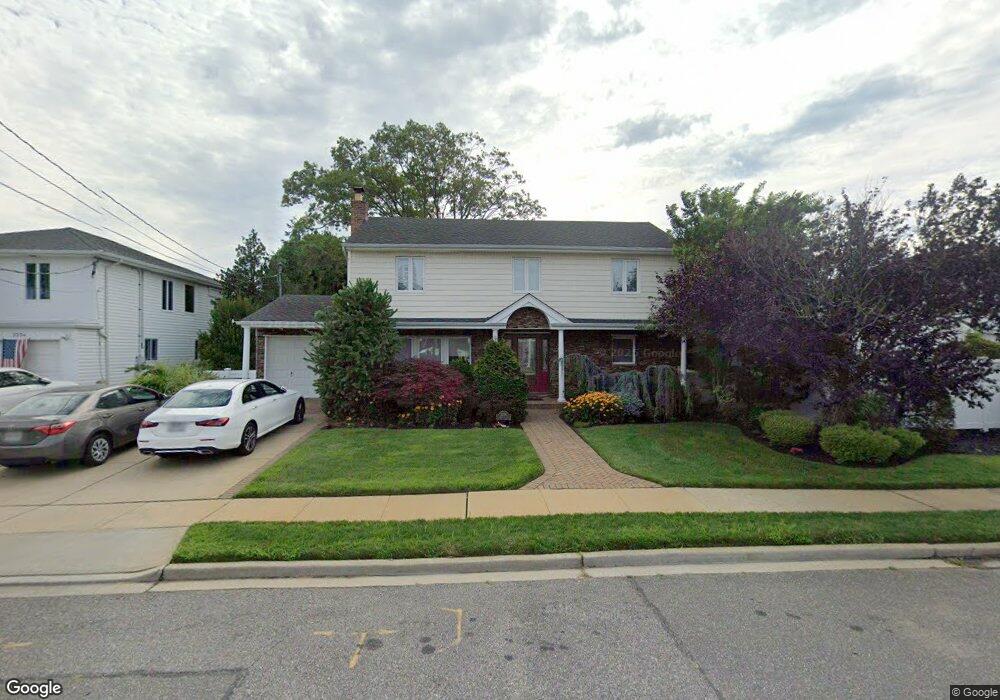
2228 Brody Ln Bellmore, NY 11710
Estimated Value: $788,488 - $926,000
--
Bed
3
Baths
1,291
Sq Ft
$664/Sq Ft
Est. Value
About This Home
This home is located at 2228 Brody Ln, Bellmore, NY 11710 and is currently estimated at $857,244, approximately $664 per square foot. 2228 Brody Ln is a home located in Nassau County with nearby schools including Lt. General Thomas P. Stafford Elementary School, Shore Road School, and Winthrop Avenue School.
Ownership History
Date
Name
Owned For
Owner Type
Purchase Details
Closed on
Jul 1, 2023
Sold by
Livingston Leon and Livingston Zena
Bought by
Livingston Douglas
Current Estimated Value
Purchase Details
Closed on
Oct 2, 2012
Sold by
Livingston Leon and Livingston Zena
Bought by
Zena R Livingston 2011
Purchase Details
Closed on
Nov 10, 1995
Sold by
Carlin Stephen and Carlin Harriet
Bought by
Livingston Leon and Livingston Zena
Home Financials for this Owner
Home Financials are based on the most recent Mortgage that was taken out on this home.
Original Mortgage
$203,000
Interest Rate
7.47%
Mortgage Type
Purchase Money Mortgage
Create a Home Valuation Report for This Property
The Home Valuation Report is an in-depth analysis detailing your home's value as well as a comparison with similar homes in the area
Home Values in the Area
Average Home Value in this Area
Purchase History
| Date | Buyer | Sale Price | Title Company |
|---|---|---|---|
| Livingston Douglas | -- | Judicial Title | |
| Livingston Douglas | -- | Judicial Title | |
| Livingston Douglas | -- | Judicial Title | |
| Zena R Livingston 2011 | -- | -- | |
| Zena R Livingston 2011 | -- | -- | |
| Zena R Livingston 2011 | -- | -- | |
| Livingston Leon | $274,500 | -- | |
| Livingston Leon | $274,500 | -- |
Source: Public Records
Mortgage History
| Date | Status | Borrower | Loan Amount |
|---|---|---|---|
| Previous Owner | Livingston Leon | $203,000 |
Source: Public Records
Tax History Compared to Growth
Tax History
| Year | Tax Paid | Tax Assessment Tax Assessment Total Assessment is a certain percentage of the fair market value that is determined by local assessors to be the total taxable value of land and additions on the property. | Land | Improvement |
|---|---|---|---|---|
| 2025 | $16,856 | $555 | $240 | $315 |
| 2024 | $4,037 | $554 | $240 | $314 |
| 2023 | $15,205 | $566 | $245 | $321 |
| 2022 | $15,205 | $566 | $245 | $321 |
| 2021 | $20,106 | $556 | $241 | $315 |
| 2020 | $13,869 | $677 | $546 | $131 |
| 2019 | $12,383 | $726 | $549 | $177 |
| 2018 | $12,502 | $774 | $0 | $0 |
| 2017 | $8,438 | $777 | $588 | $189 |
| 2016 | $11,841 | $822 | $593 | $229 |
| 2015 | $3,540 | $868 | $557 | $311 |
| 2014 | $3,540 | $868 | $557 | $311 |
| 2013 | $3,488 | $911 | $585 | $326 |
Source: Public Records
Map
Nearby Homes
- 2858 Shore Rd
- 2468 Riviera Ln
- 2072 Legion St
- 2694 Dorothy St
- 3058 Susan Rd
- 3142 Shore Rd
- 2074 Ellen Dr
- 2406 Legion St
- 14 Island Plaza
- 2956 Judith Dr
- 2523 Horace Ct
- 2545 Horace Ct
- 2925 Hewlett Ave
- 3200 Lydia Ln
- 2794 Judith Dr
- 2476 Florin Ct
- 2810 Wynsum Ave
- 14 Bell Ct
- 2770 Lincoln Blvd
- 2072 Brighton Way